Our system will evaluate the answer based on this AI-generated description.
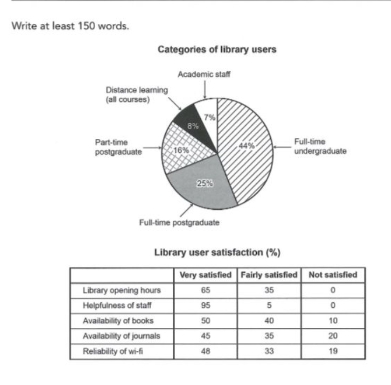
The image contains a pie chart titled 'Categories of library users' and a table titled 'Library user satisfaction (%)'. The pie chart breaks down library users as follows: Full-time undergraduate 44%, Full-time postgraduate 25%, Part-time postgraduate 16%, Distance learning (all courses) 8%, and Academic staff 7%. The table shows satisfaction levels for five categories: For Library opening hours, 65% were Very satisfied, 35% Fairly satisfied, and 0% Not satisfied. For Helpfulness of staff, 95% were Very satisfied, 5% Fairly satisfied, and 0% Not satisfied. For Availability of books, 50% were Very satisfied, 40% Fairly satisfied, and 10% Not satisfied. For Availability of journals, 45% were Very satisfied, 35% Fairly satisfied, and 20% Not satisfied. For Reliability of wi-fi, 48% were Very satisfied, 33% Fairly satisfied, and 19% Not satisfied.
Given the complexity of the image, the above description may not be entirely accurate.
Skyrocket your IELTS band score by 1-2 points in under a month with our premium plan!
Note: Both the topic and the answer were created by one of our users.
The pie chart and table chart demonstraiting us results of questionnaire of library users at a university. Outline the information by selecting and reporting the main charateristic, and make comparisons.
Overall, in the first chart the most visited categories of library is full-time undergraduated and majority of people satisfied of reading room. However many people dont like availability of journals.
In pie chart we see that, smallest percent of library users its academic stuff, its only 7%, then the differents of percent not enormous , its distance learning – 8%, according to the information part-time postgraduated compose 16%, and a quarter % its full-time postgraduated , last but not least, the bigest categories of librare users its full-time undergratuated – 44%.
Turning to the table chart, helpfulness of stuff were highly enjoyed – 95% , while reliability of wi-fi was only very liked -48% and 19%- not satisfied at all. Availability of books stood at half percent. This categories doesn’t have ane bad feedback – library opening hours , and has 65 – very loved.
Word Count: 175
