Our system will evaluate the answer based on this AI-generated description.
The image presents two sets of data on education levels in Glasgow, 2010: a bar chart displaying education levels by age group and a pie chart illustrating education levels by gender. In the age group bar chart, age 16-24 shows 71% with university degrees, 19% with school certificates, and 10% with no qualifications; age 25-35 indicates 71% university degrees, 20% school certificates, and 9% no qualifications; age 35-50 reveals 70% university degrees, 20% school certificates, and 10% no qualifications; age 50-75 shows 60% university degrees, 30% school certificates, and 10% no qualifications; age 75+ has 50% with school certificates, 25% each for university degrees and no qualifications. The gender-based pie chart demonstrates that women have 38% university degrees, 29% school certificates, and 33% no qualifications, whereas men possess 35% university degrees, 30% school certificates, and 35% no qualifications.
Given the complexity of the image, the above description may not be entirely accurate.
Skyrocket your IELTS band score by 1-2 points in under a month with our premium plan!
Note: Both the topic and the answer were created by one of our users.
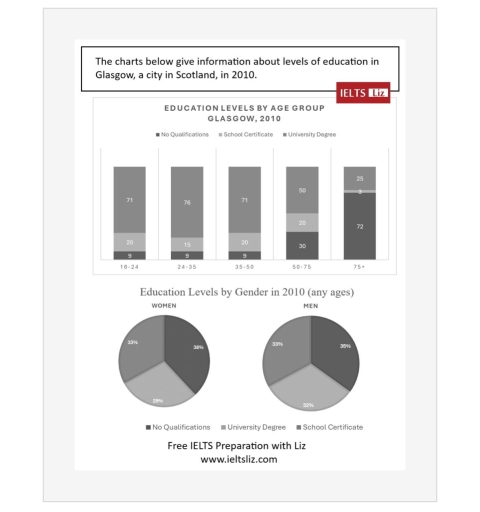
The bar chart illustrates the percentage of individuals in Glasgow with three levels of education (university education, school certificate, and those with no qualifications), in 2010. The bar chart is divided into five age groups, while the pie charts show the information by genders.
Overall, majority of people under the age of 50 had university education compared to those in the oldest age group. Those 75 years old and above almost had no qualification.
About 70% of individuals under 50 years had university degree, dropping to 50% between those aged 50 and 75 years. People who were 75 years and older had only 25% university education. In terms of school certificate, it was either 20% or 15% for 16 to 50 years olds, whereas only 3% in those 75 years old and above. Only 9% of people aged below 50 years had no qualifications, in comparison to 72% in the oldest age group.
Both genders had same proportion for school certificates (33%). In terms of university degree, 3% more men had university degree than women (32% and 29% respectively). Conversely, 3% more women had no qualification as compared to men ( 38% and 35%).
Word Count: 194
