Our system will evaluate the answer based on this AI-generated description.
The image shows a bar chart comparing the frequency of eating at fast food restaurants among people in the USA from 2003 to 2013. The percentages of people who ate fast food everyday decreased from 5% in 2003 to 3% in 2013. The number of people who ate several times a week increased from 20% in 2003 to around 26% in 2013. The percentage of people eating fast food once a week saw a slight decrease from 30% in 2003 to around 28% in 2013. The number of people eating fast food once or twice a month remained relatively stable at around 20%. The percentage of people eating fast food a few times a year increased from around 18% in 2003 to 25% in 2013. Lastly, the number of people who never ate fast food dropped from around 10% in 2003 to around 4% in 2013. Overall, there seems to be a shift towards eating fast food more frequently, but less frequently than every day.
Given the complexity of the image, the above description may not be entirely accurate.
Skyrocket your IELTS band score by 1-2 points in under a month with our premium plan!
Note: Both the topic and the answer were created by one of our users.
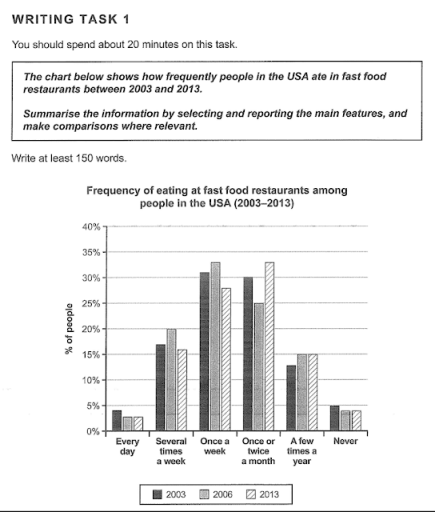
The bar chart below shows information about the routine in eating fast food in restaurants belonging to residents in the USA from 2003 to 2013.
Overall, between 2003 and 2013, there was a significant change among three years in each option. The once a week frequency became the top preference whereas the opposite was true for the everyday one.
In 2003, the percentage of routine that people ate fast food every day was 4%, then it achieved a four-fold increase in the several times a week counterpart. After experiencing the prevalence in the once a week regularity, at 31%, it slightly decreased to 30%. Afterwards, a few times a year expenditure recorded a two-fold decline and never one saw the same change of that.
In 2006 and 2013, both figures shared the same rate in the everyday and never recurrence, 3% and 4% respectively. Subsequently, there was a significant disparity between them in the two times of week categories, which was by 4% before these figures swapped, by about 8% in the once or twice a month. The next choice which was less frequent saw the same proportion of these years, holding the three-fold increase compared to the final.
Word Count: 199