Our system will evaluate the answer based on this AI-generated description.
The image displays a bar chart detailing land usage measured in millions of hectares from 1950 to 2010 across three categories: Agriculture (livestock), Agriculture (crops), and Non-agricultural. In 1950, livestock usage is approximately 40 million hectares, crops are at 210 million hectares, and non-agricultural lands are at 80 million hectares. By 1960, livestock remains at 40 million, crops at 210 million, non-agricultural slightly increases to about 90 million hectares. In 1970, livestock is just below 40 million, crops maintain 210 million, and non-agricultural is around 100 million. By 1980, livestock increases marginally to around 60 million, crops stay at 200 million, non-agricultural usage remains at 100 million hectares. In 1990, livestock is just over 50 million, crops dip slightly below 200 million, non-agricultural lands are over 110 million. In 2000, livestock is at approximately 80 million, with crops maintaining near-constant at just below 200 million, while non-agricultural stays steady at 110 million. In 2010, livestock usage is nearly at 90 million, crops return to 200 million, and non-agricultural land usage slightly decreases to around 95 million hectares.
Given the complexity of the image, the above description may not be entirely accurate.
Skyrocket your IELTS band score by 1-2 points in under a month with our premium plan!
Note: Both the topic and the answer were created by one of our users.
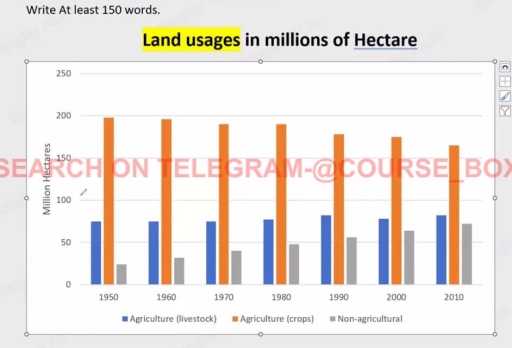
The bar graph provides information about the amount of land which was used for crop farming, livestock farming, and non-agricultural purposes in a country in Asia in 2011.
Overall, it can be seen that land use for crop agriculture decreased, whereas that for livastock agriculture and non-agricultural use increased. Further, the uses of land for crop agriculture were consistently the highest, and that for non-agricultural purposes were always the lowest.
Looking at the crop data set in more detail, it is evident that the amount of land which was used for these purposes stood at about 200 million hectares (m/h) in 1950. This figure declined to 190 m/h in 1970 and remained constant until 1980. By 2010, it had declined to approximately 165 m/h.
Turning to the livestock farming, it can be seen that, the uses of land for these purposes was about 75 m/h in 1950. This value remain unchanged until 1970, but then grew to about 82 m/h in 1990. It remain constant in this value until 2010.
Finally, land use for non-agricultural purposes was around 25 m/h in 1950. The uses of land for this purpose grew expontinentially to about 75 m/h in 2010.
Word Count: 197