🔥 Today Only: Save 30% on Premium — Offer Ends Soon! - Upgrade Now!
Table

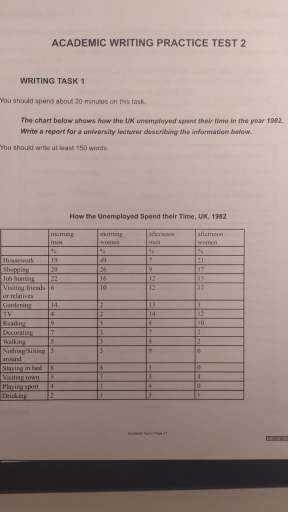
Band 4+: The chart below shows how the UK unemployed spent their time in the year 1982.

Image for topic: The chart below shows how the UK unemployed spent their time in the year 1982.
Our system will evaluate the answer based on this AI-generated description.
The image presents a table detailing how the unemployed spent their time in the UK in 1982, divided into morning, afternoon, and evening activities. Housework: 20 (morning), 16 (afternoon), 19 (evening); Shopping: 26 (morning), 10 (afternoon), 17 (evening); Job Hunting: 22 (morning), 19 (afternoon), 12 (evening); Visiting friends: 29 (morning), 24 (afternoon), 13 (evening); Writing/Broadcasting: 2 (morning), 11 (afternoon), 17 (evening); Car repairs/DIY: 16 (morning), 13 (afternoon), 7 (evening); Gardening: 17 (morning), 18 (afternoon), 7 (evening); Reading: 5 (morning), 8 (afternoon), 18 (evening); Sports: 9 (morning), 15 (afternoon), 6 (evening); Hobbies: 9 (morning), 7 (afternoon), 8 (evening); Watching TV: 4 (morning), 9 (afternoon), 22 (evening); Resting: 4 (morning), 7 (afternoon), 6 (evening); Eating: 0 for all three periods; Playing: 9 (morning), 6 (afternoon), 0 (evening); Socializing: 2 (morning), 0 (afternoon), 8 (evening); Talking: 0 (morning), 8 (afternoon), 9 (evening); Doing nothing: 10 (morning), 17 (afternoon), 10 (evening); Drinking: 0 for all three periods.
Given the complexity of the image, the above description may not be entirely accurate.
Note: Both the topic and the answer were created by one of our users.

The figure illustrates how jobless people utilized their time in the UK in the year 1982. The units of measurement are given in percentages.

Overall, men mostly spent their morning hours searching for jobs and only a few spent that time drinking, sitting around and playing sports. As far as women were concerned, majority concentrated on housechores and a few on outdoor activities such as drinking, playing sport and walking. In the afternoon, men were either glued on the television or gardening.

Firstly, both gender had various activities to do despite of failure to secure a job. The males, were mostly seen looking for an employment that is 22% and only between 2-4 per cent spent their time drinking, watching TV and playing sport in the wee hours.

On the other hand, women majored in house keeping in both morning and in the afternoon and the number was 49% and 21 per cent respectively. Furthermore no woman was witnessed staying on the bed or playing games.

Word Count: 166

Answers On The Same Topic:

The chart below shows how the UK unemployed spent their time in the year 1982.

The chart illustrates the information about how the UK unemployed spent their times in the 1982. Overall, there are 14 types of pursuits that the unemployed British did, from which housework was popular among men and women, and drinking experienced the lowest demand. To begin with women, they had a tendency for shopping and household […]

The chart below shows how the UK unemployed spent their time in the year 1982.

The table compares how unemployed females and males in the UK spent their time in 1982. The data includes both genders’ morning and afternoon routines. Overall, it is evident that the percentage of women who did housework, shopping, or visited relatives or friends was significantly higher than the rate for men. Meanwhile, the proportion of […]

The chart below shows how the UK unemployed spent their time in the year 1982.

The chart provides us with a statistic about unemployed people in the UK and how they spend their time. As shown at the table, we have the information on how people prefer to spend their leisure time. Both women and men actually have the criteria, like morning and afternoon. For example, the data shows as […]

See All

Other Topics:

The table below shows the percentages of individuals under the age of 18 and over 60 in California, Utah, and Florida, as well as their average annual income and impoverished population.

The table illustrates the percentages of citizens aged under 18 and over 60 while showing the average income and the rates of population living in poverty across three nations: California, Utah, and Florida. Overall, Utah has the highest proportion for young individuals while Florida possesses the highest proportion for older individuals. In regard to the […]

The table below shows the percentages of individuals under the age of 18 and over 60 in California, Utah, and Florida, as well as their average annual income and impoverished population.

The table illustrates the percentages of citizens under 18 and over 60 years old while showing the average income and the rates of population living in poverty across 3 nations: California, Utah, Florida. Overall, Utah has the highest proportion of young individuals while Florida possesses the highest proportion of old individuals. In regard to the […]

The table below gives information about the average annual spending by university students in three different countries in 2007. It shows their total average spending and their spending on various different living costs.

The table illustrates the data about the average annual expenditures in US dollars on five different categories by university students in three different countries in 2007. Overall, country a and country b recorded the highest percentage of spending on acommodation, while country c recorded most expenditure on food. Books was the lowest category of expenditure […]

The table below shows sales made by a coffee shop in an office building on a typical weekday.

The table provide the information about the sales of a coffee shop at located in the office building in an ordinary weekday. It was experssed in numeric. Overall, it can be seen that, table contain five rows and five columns. Each column were labeled such as Coffee, Tea, Pastries, Sandwiches. In the first column, time […]

The bar chart shows the percentage of people using four types of transportation in a city in 2010 and 2020.

The table illustrates the proportion of citizens using four different modes of transport in a particular city in 2010 and 2020. Overall, cars remained the most popular mode of transportation throughout the period, followed by buses in 2010 and bicycles in 2020. Additionally, while the usage of cars and bicycles experienced an upward trend, the […]

The table below shows employment patterns for males and females in NewZealand in 1993 and 2003. Summarise the information by selecting and reporting main features,andmake comparisons where relevant.

The given table represents the proportion of male and female employees in six different sectors in New Zealand between 1993 and 2003. Overall, it is clear that male dominated IT, Farming, and Building sectors in both years, although male employees declined from these sectors over the period, while the proportion of female employees in the […]

See All
We have detected unusual activity on your device.
Please verify your identity to continue.
Note: This verification step won't sign you in. If you have a premium account, please log in to access the service as usual.
Google/Gmail Verification
Or verify using Email/Code
We've sent a verification code to:
youremail@gmail.com (Not your email?)
Enter it below to complete the verification process.
Ensure your email address is correct, your inbox is not full, and you check your spam folder. If no email arrives, consider using an alternative email.
You will need a Premium plan to perform your action!
Note: If you already have a premium account, please log in to access our services as usual.

Plans & Pricing

Our mission is to make quality education accessible for everyone.
However, to keep our hardworking team running and this service alive, we genuinely need your support!
By opting for a premium plan, not only do you sustain us in achieving the mission, but you also unlock advanced features to enrich your learning experience.

Free

For learners who aren't pressed for time

What's included on Free
100+ Cambridge IELTS Tests
Instant IELTS Writing Task 1 & 2 Evaluation (2 times/month)
Instant IELTS Speaking Part 1, 2, & 3 Evaluation (2 times/month)
Instant IELTS Writing Task 1 & 2 Essay Generator (2 times/month)
500+ Dictation & Shadowing Exercises
100+ Pronunciation Exercises
Flashcards
Other Advanced Tools

Premium

For those serious about advancing their English proficiency, and for IELTS candidates aspiring to boost their band score by 1-2 points (especially in writing & speaking) in just 30 days or less

What's included on Premium
Save Your IELTS Test Progress & Analyze Mistakes By Question Type
Save Your Own Flashcard Sets & Use Them On Any Device
Unlock All Courses, IELTS Tests, Section & Part Practice
Unlimited AI Conversations
Unlimited AI Writing Enhancement Exercises
Unlimited IELTS Writing Task 1 & 2 Evaluation
Unlimited IELTS Speaking Part 1, 2, & 3 Evaluation
Checked Answers Will Not Be Published
Unlimited IELTS Writing Task 1 & 2 Essay Generator
Unlimited IELTS Speaking Part 1, 2, & 3 Sample Generator
Unlimited Usage Of Advanced Tools & AI Features
Priority Support within 24h (12-month plan only)

Due to the nature of our service and the provided free trials, payments are non-refundable.