Our system will evaluate the answer based on this AI-generated description.
The image is a line graph with four lines labeled Domo, Lex, Slim TX, and Alpha, showing data from January to September. Domo begins at approximately 7, rises to about 8.5 in February, drops slightly in March to around 8, falls to about 7 in April, climbs sharply to 12 in May, continues to rise to 18 in June, 20 in July, nearly 22 in August, and spikes to roughly 25 in September. Lex starts at approximately 11, fluctuates between 11 and 13 from February to May, rises slightly to around 14 in June, jumps to approximately 17 in July, continues the rise to about 18.5 in August, and maintains the same value in September. Slim TX begins at about 6, dips to roughly 5.5 in February, sees a minor increase to 6 in March, maintains until a sharp rise to 10 in April, gradually climbs to 11 in May, further rises to nearly 14 in June, remains stable until a sharp increase to around 19 in August, and peaks to approximately 20 in September. Alpha starts at nearly 24, dips to around 23 in February, drops sharply to 14 in March, continues the fall to about 9 in April, sees a minor climb to around 10 in May, drops slightly below 10 in June, begins to rise in July to approximately 10.5, continues the rise to about 12 in August, and sees a sharp peak to roughly 20 in September. The scale is from 0 to 30, and data points are marked with shapes corresponding to each line.
Given the complexity of the image, the above description may not be entirely accurate.
Skyrocket your IELTS band score by 1-2 points in under a month with our premium plan!
Note: Both the topic and the answer were created by one of our users.
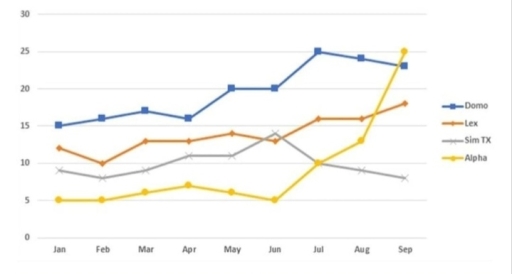
The graph illustrates the average price of monthly plan for four various cellular phones in a European nation for nine months in 2002.
Overall, the information that stood out from the graph was very striking showcasing the performance of Alpha mobile who surged highest cost in september, whereas SIM TX who started better than Alpha mobiles had declined least, than other mobiles average prices.
In January,2002 Alpha company offered 5 euros that remained steady for five months. After five months, Alpha mobiles prices showed dramatically increasing trend at 25 euros. Lex mobiles started with 13 euros following downward trend in February, then an upward increasing trend till June.In July, August and September the costs increase till September.Domo started offering from 15 euros after April, the average price increased in May, that was steady in the month of June and then improved further to 25 euro, indicatiing downward trend in August and September.
However, the SM TX mobiles commenced average price from 8 euros in Januray, facing a depression in February, offered better average prices in March and April, which was steady in May. But in July, August and September SM TX mobiles reached its starting average cost to 8 euros
Word Count: 200