Our system will evaluate the answer based on this AI-generated description.
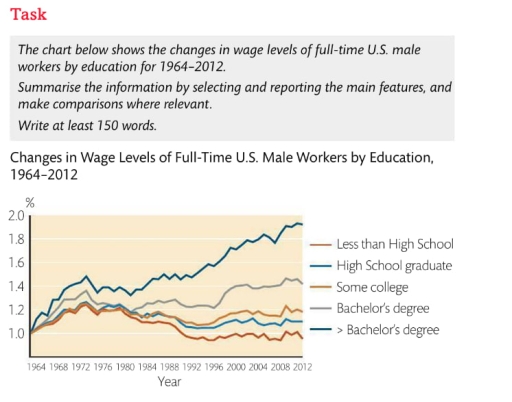
The image shows a line chart of wage levels for full-time U.S. male workers by education from 1964 to 2012. In 1964, less than high school was at 1.0, high school graduate at 1.0, some college at 1.0, bachelor's degree at approximately 1.54, and >bachelor's degree at approximately 1.68. By 1972, less than high school rose slightly above 1.0, high school graduate was at 1.2, some college at 1.25, bachelor's degree just under 1.8, and >bachelor's degree at approximately 1.9. In 1984, levels were as follows: less than high school at 1.1, high school graduate below 1.3, some college at approximately 1.4, bachelor's degree at 1.6, and >bachelor's degree peaking at 1.9. By 1996, less than high school dropped below 1.0, high school graduate near 1.1, some college about 1.2, bachelor's degree above 1.5, and >bachelor's degree at 1.8. In 2004, less than high school remained at 0.9, high school graduate just above 1.0, some college near 1.2, bachelor's degree around 1.6, >bachelor's degree at 1.9. Finally, in 2012, less than high school stayed at 0.8, high school graduate at 1.0, some college at 1.2, bachelor's at 1.6, with >bachelor's degree reaching 1.9.
Given the complexity of the image, the above description may not be entirely accurate.
Skyrocket your IELTS band score by 1-2 points in under a month with our premium plan!
Note: Both the topic and the answer were created by one of our users.
The chart below illustrates how wage levels for full-time U.S. male workers has changedby level of education. The data is based on men’s education levels and ismeasured in 0.2 percentage at four-year intervals between 1964 and 2012.
In general,it is clear that while people who did not attend university have mostly similar salaries, those with a bachelor’s degree or higher earned significantly more.
The dark green line, representing men with more than a bachelor’s degree, showed the strongest performance. Over the given period, it roughly doubled, rising from 1% to approximately 1.9%, reaching the highest wage level in 2012. Furthermore,the chart below also shows lines with slight increases in salaries for males who graduated from college or high school in 0.2% and 0.1%, respectively.
The only line which showed decrease was orange once, represented men who graduated lessthan a high school. Their wage level fell from 1.3% in 1974 to 0.9% in 2012.
Word Count: 153
