Our system will evaluate the answer based on this AI-generated description.
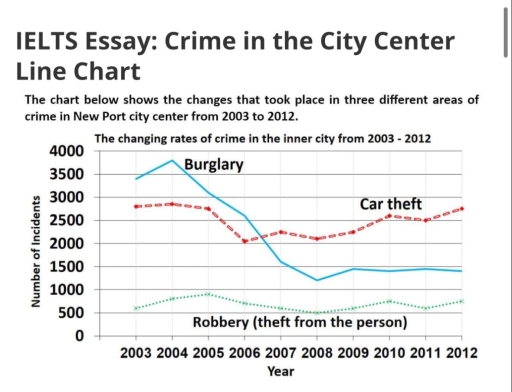
The image is a line chart titled "IELTS Essay: Crime in the City Center" showing changes in three different areas of crime in New Port city center from 2003 to 2012. Three crime categories are displayed: Burglary, Car theft, and Robbery (theft from the person), with data points for each year from 2003 to 2012. Burglary starts at roughly 3750 incidents in 2003, decreasing to about 3500 in 2004, rising to almost 3750 in 2005, then decreasing steadily to around 600 in 2012. Car theft starts at 3500 incidents in 2003, decreases to roughly 3000 in 2004, fluctuates close to 2750 from 2005 to 2007, rises slightly to 3000 in 2008, then falls steadily to around 1500 in 2012. Robbery (theft from the person) begins at just below 1000 incidents in 2003, remains stable until a rise to approximately 1200 in 2006, then falls steadily to around 200 in 2012. The horizontal axis denotes the years, with specific years marked as 2003 through 2012, while the vertical axis documents the number of incidents from 0 to 4000 in increments of 500.
Given the complexity of the image, the above description may not be entirely accurate.
Skyrocket your IELTS band score by 1-2 points in under a month with our premium plan!
Note: Both the topic and the answer were created by one of our users.
The line graph illustrates the trends in burglary, vehicle theft, and robbery in New Port city center over a nine-year span from 2003 to 2012, measured by the number of incidents. Overall, burglary declined dramatically and lost its dominant position, vehicle theft remained comparatively stable with a modest upward shift, and robbery consistently represented the least frequent type of crime.
At the outset, burglary was the most prevalent offense, beginning at approximately 3,800 incidents in 2003 and reaching a peak the following year. Subsequently, the figure plummeted steeply to nearly 1,200 by 2008, after which it steady and continued at this relatively low level for the remainder of the period.
In contrast, car theft hovered at around 2,800 during the initial years, displaying only limited fluctuations. At a later stage, however, the figure followed a gentle upward trajectory, concluding at nearly 2,700 cases by 2012 and thereby surpassing burglary from 2007 onwards. Turning to robbery, this category exhibited only minor variations, never surpassing the 1,000 mark.
Word Count: 166
