24 Hours Only: Get 39% OFF on Our Premium Plan - Check Out Now!
Bar Chart

Band 5+: The chart below shows the expenditure on three categories among different age groups of residents in the UK in 2004

Image for topic: The chart below shows the expenditure on three categories among different age groups of residents in the UK in 2004
Our system will evaluate the answer based on this AI-generated description.
The image displays a vertical bar graph titled "Citizens' Expenditure in The UK" representing percentages of total spending by age groups in the UK in 2004 across three categories: Food and Drink, Restaurant and Hotel, and Entertainment. "Under 30" spent approximately 15% on Food and Drink, 17% on Restaurant and Hotel, and 5% on Entertainment. Age group "31-45" had similar Food and Drink spending at about 15%, higher Restaurant and Hotel spending at approximately 22%, and slightly higher Entertainment expenditure at around 7%. The "46-60" age group displayed a decrease in Food and Drink spending to roughly 12%, a peak in Restaurant and Hotel spending at nearly 25%, and a slight increase in Entertainment spending to about 8%. "61-75" showed a significant drop in Food and Drink to around 8%, Restaurant and Hotel to approximately 17%, and Entertainment to nearly 6%. Finally, the "76+" age group showed a consistent Food and Drink percentage to "61-75", a decrease in Restaurant and Hotel to roughly 14%, and a sharp decline in Entertainment to under 5%. Overall, the graph indicates that as age increases, the percentage of total spending on Food and Drink and Entertainment generally decreases, while Restaurant and Hotel spending peaks in the middle age group before declining.
Given the complexity of the image, the above description may not be entirely accurate.
Note: Both the topic and the answer were created by one of our users.

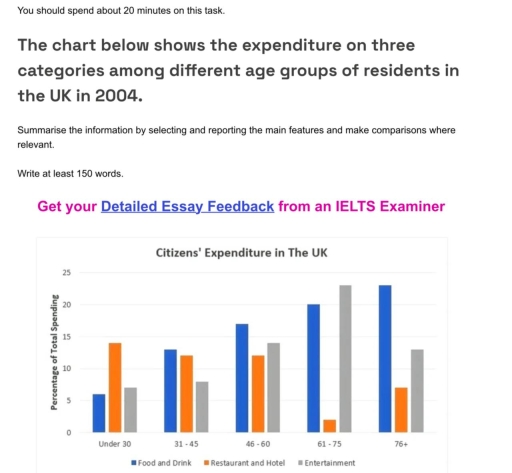
The bar chart displays the total percentage spending among different age groups living in the UK on three given categories in the year 2004.

Overall, majorit of the given age group gave more money on food and entertainment and only 1 group gave much money on restaurants and Hotel.

On one hand, individuals, under the age of 30 spent almost 15% of their money on restaurants and Hotel, approximately 6% and 7% were paid for entertainment and food respectively. Residents, from the age of 31-45 gave a slightly equal amount of money on food, drink and restaurant and hotel since they are both between 10-15% range.

On the other hand, adults, aging 46-60 and 76 plus gave more importance on their food and drink which recorded a little more than 15 and 20% respectively. For the 61-75 age group, 23% of their money was spent on entertainments and exactly 20% on food and drinks. This age did not really fancy going to restaurants and hotel since it only had a total spending of below 5%.

Word Count: 175

Answers On The Same Topic:

The chart below shows the expenditure on three categories among different age groups of residents in the UK in 2004

The bar graph illustrates how much money was spent by British citizens in 2004 on three different kinds of items, including food and drink, restaurant and hotel and entertainment. In general, it can be seen that the spend of food and drink was the least by under 30 age but it showed the highest expenditure […]

The chart below shows the expenditure on three categories among different age groups of residents in the UK in 2004

The given bar chart illustrates how much money was spent on three categories by five various age groups of citizens in the UK in 2004. Overall, UK residents of all age groups generally allocated the highest proportion of their money to food and drink, especially this figure was underlined at group of over 61. It […]

The chart below shows the expenditure on three categories among different age groups of residents in the UK in 2004

The bar chart illustrates how much money was spent on three categories by five different age groups of residents in the UK in 2004. Overall, UK residents of all age groups generally spent the highest proportion of their money on food and drink. It is also evident that people aged 61 to 75 recorded the […]

See All

Other Topics:

The chart below shows the number of people employed in five types of work in one region of Australia in 2001 and 2008. Summarize the information by selecting and reporting the main features, and make comparisons where relevant.

The given diagram below shows the total number of individuals employed in five type of majority in one region of Australia in 2001 and 2008. 2001 is colored by white and 2008 by black colour’s.There are 5 types of given informations like sales, accounting, computing, nursing and farming. Obviously we can see that, sales were […]

The chart below shows the nimbers of women in futher education in Britain in three periods.

The chart below demonstrate the number of males and females in further education in Britain across three different periods, indicating wether they studied full-time or part-time. Overall part-time education was more popular than part time for both genders in three periods. When In 1970 and 71 about million men studying part-time education, around women 700 […]

The chart below shows the results of a European survey into young people's expectations for change in five different areas of life in the next 20 years. They were asked if they thought things would improve or get worse. Summarise the information by selecting and reporting the main features, and make comparisons where relevant.

The diagram above illustrates the results of a european group into youth’s expectations for difference in five specific areas in life through the next 20 years. They were asked if they expect things would improve or get worse. Overall, youth expects that ,communication between people will improve most among the other areas which is 54 […]

the graph shows the percentages of people going to the cinemas in a European country on different days

The bar chart illustrates the proportion of people going to cinemas in a European country on different days over a four-year period, commencing from 2003. Overall, the proportion of people who went to the cinema on Saturday recorded the highest proportion of attendance, followed by Sunday, while Wednesday had the lowest figure. Tuesday and Wednesday […]

The bar chart details information about the proportion of households with various items—a telephone, microwave, CD player, mobile phone, home computer, clothes dryer, internet, and dishwasher—between 2001 and 2008.

The bar chart illustrates about percentage of British households that had several items in 2001 and 2008. Overall, Househods items are experienced with garadually increase, while, only telephone users is the highest in 2001. However, in 2008 several items undergone with sharply increase through the period. In addition, for the least figure is the internet […]

The bar chart below shows transport preference among young people in four countries in a single year.

Intro: Information regarding youth preferences of traveling methods is big depicted by the bar graph. The data has been calibneted in numbers. Overall: In general the maximum can be seen in Italy in case of car. On the other hand inverse can be seen also In Italy in case of motorcycle. It is worth noticing […]

See All
We have detected unusual activity on your device.
Please verify your identity to continue.
Note: This verification step won't sign you in. If you have a premium account, please log in to access the service as usual.
Google/Gmail Verification
Or verify using Email/Code
We've sent a verification code to:
youremail@gmail.com (Not your email?)
Enter it below to complete the verification process.
Ensure your email address is correct, your inbox is not full, and you check your spam folder. If no email arrives, consider using an alternative email.
You will need a Premium plan to perform your action!
Note: If you already have a premium account, please log in to access our services as usual.

Plans & Pricing

Our mission is to make quality education accessible and free for everyone.
However, to keep our hardworking team running and this service alive, we genuinely need your support!
By opting for a premium plan, not only do you sustain us in achieving the mission, but you also unlock advanced features to enrich your learning experience.

Free

For learners who aren't pressed for time

What's included on Free
1000+ IELTS Tests & Samples
Instant IELTS Writing Task 1 & 2 Evaluation (2 times/month)
Instant IELTS Speaking Part 1, 2, & 3 Evaluation (5 times/month)
Instant IELTS Writing Task 1 & 2 Essay Generator (2 times/month)
500+ Dictation & Shadowing Exercises
100+ Pronunciation Exercises
Flashcards
Other Advanced Tools

Premium

For those serious about advancing their English proficiency, and for IELTS candidates aspiring to boost their band score by 1-2 points (especially in writing & speaking) in just 30 days or less

What's included on Premium
Save Your IELTS Test Progress
Unlock All Courses & Content
Unlimited AI Conversations
Unlimited AI Writing Enhancement Exercises
Unlimited IELTS Writing Task 1 & 2 Evaluation
Unlimited IELTS Speaking Part 1, 2, & 3 Evaluation
Checked Answers Will Not Be Published
Unlimited IELTS Writing Task 1 & 2 Essay Generator
Unlimited IELTS Speaking Part 1, 2, & 3 Sample Generator
Unlimited Usage Of Advanced Tools

Due to the nature of our service and the provided free trials, payments are non-refundable.
Nếu bạn là người Việt Nam và không có hoặc không muốn trả bằng credit/debit cards, bạn có thể thanh toán bằng phương thức chuyển khoản:


Chọn gói:
279,000₫ 157,000 ₫ cho gói 1 tháng (chỉ 5,233₫/ngày)
819,000₫ 397,000 ₫ cho gói 3 tháng (chỉ 4,411₫/ngày)
1,649,000₫ 667,000 ₫ cho gói 6 tháng (chỉ 3,706₫/ngày)
3,299,000₫ 857,000 ₫ cho gói 12 tháng (chỉ 2,381₫/ngày)


Sau khi chuyển khoản, vui lòng đợi trình duyệt tự động điều hướng bạn trở lại Engnovate và bạn sẽ ngay lập tức nhận được mã kích hoạt tài khoản premium.
Nếu có lỗi xảy ra, bạn có thể liên hệ với team thông qua một trong các phương thức: email đến helloengnovate@gmail.com hoặc nhắn tin qua facebook.com/engnovate.
Vì toàn bộ công cụ trên website đều có thể sử dụng thử miễn phí, Engnovate không hỗ trợ hoàn tiền.