Our system will evaluate the answer based on this AI-generated description.
The image shows a bar graph representing the global sales of four different kinds of digital games (Mobile Phone Games, Online Games, Console Games, Handheld Games) from 2000 to 2006, with values in billion dollars on the y-axis and years on the x-axis. In 2000, Mobile Phone Games sales were at 1.2 with Online Games slightly above 0, Console Games at 6, and Handheld Games between 2 and 3. In 2001, Mobile Phone Games were still at 1.2, Online Games were still slightly above 0, Console games fell slightly below 6, and Handheld Games increased to between 3 and 4. In 2002, Mobile Phone Games increased to between 1.5 and 2, Online Games were still slightly above 0, Console Games dropped to 3, and Handheld Games decreased to between 0 and 1. In 2003, Mobile Phone Games decreased slightly below 1.5, Online Games increased to 1, Console Games rose dramatically to between 10 and 11, and Handheld Games increased to between 2 and 3. In 2004, Mobile Phone Games increased to between 3 and 4, Online Games to 2, Console Games decreased to 9, and Handheld Games rose to between 4 and 5. In 2005, Mobile Phone Games increased to between 7 and 8, Online Games to 3, Console Games rose slightly above 9, and Handheld Games increased to between 5 and 6. In 2006, Mobile Phone Games increased to between 9 and 10, Online Games increased to between 3 and 4, Console Games rose to between 15 and 16, and Handheld Games rose slightly above 5.
Given the complexity of the image, the above description may not be entirely accurate.
Skyrocket your IELTS band score by 1-2 points in under a month with our premium plan!
Note: Both the topic and the answer were created by one of our users.
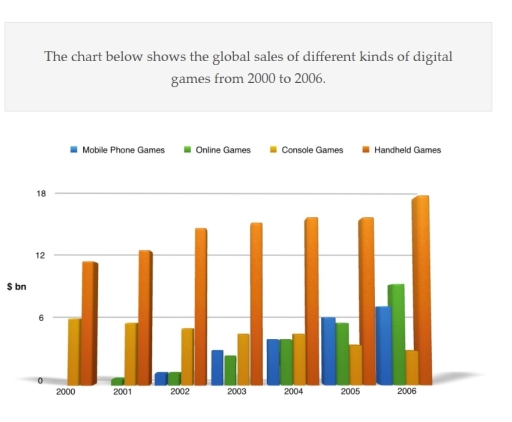
The given bar graph represents worldwide sales of various kinds of electronic games between the years 2000 and 2006.
Overall, the sales of handheld games show dominance over others, and they have increased over the years. Similarly, mobile phone and online games have also experienced a rise in sales. Whereas, the sales of console games have decreased over time.
Console games and handheld games are the only two games listed in the data for the year 2000. Online games and mobile phone games are listed in 2001 and 2002, respectively. Meanwhile, from the early years, the sales of handheld games have been increasing from approximately $10 billion to $18 billion. While, console game sales have experienced a decline from $6 billion to $3 billion.
The sales of mobile phone games and online games have only increased over time from the early years. In 2001, online games sales were nearly $1 billion, which rose to nearly $8 billion. Similarly, in 2002, mobile phone games sales were nearly $2 billion and went up to more than $7 billion in 2006. Moreover, both games shared equal sales in the years 2002 and 2004
Word Count: 190
