Our system will evaluate the answer based on this AI-generated description.
The image presents a line graph detailing the percentage of Australian-born individuals originating from various global regions between 1976 and 2011. In 1976, the Total was approximately 23%, UK was around 14%, Other was about 8%, and Asia was roughly 0%. By 1981, these figures were roughly 23% Total, about 13% UK, approximately 9% Other, barely 1% Asia. In 1986, percentages were around 24% Total, 12% UK, nearly 10% Other, slightly above 1% Asia. In 1991, Total was approximately 25%, UK was around 11%, Other roughly 11%, Asia nearly 2%. For 1996, Total remained near 25%, around 10% UK, about 12% Other, 3% Asia. By 2001, Total was around 26%, UK was near 8%, Other roughly 13%, Asia slightly below 4%. In 2006, Total was about 27%, UK at nearly 7%, Other at approximately 14%, Asia slightly above 5%. Finally, in 2011, Total reached about 28%, UK stayed around 6%, Other roughly 16%, with Asia just under 7%.
Given the complexity of the image, the above description may not be entirely accurate.
Skyrocket your IELTS band score by 1-2 points in under a month with our premium plan!
Note: Both the topic and the answer were created by one of our users.
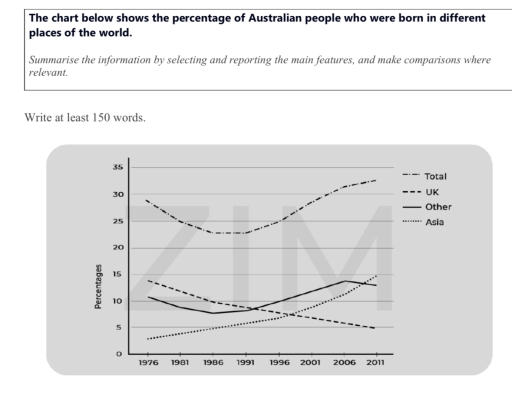
The line graph illustrates how the proportion of Australian people born in different parts of the world changed, over thirty-five years between 1976 and 2011.
Overall, the percentage of the Australian people who were born in Asia, other parts of the world and in total rose during the period, albeit to varying degrees. Interestingly, the share for the U.K saw a complete downward trend.
Looking in total, just below 30% of people were born in different spots of the world in 1976. Despite declining significantly in 1991, it reached its initial point at around 30% in 2001, following with substantial grow from 30% in 2001 to approximately 33% in 2011.
Meanwhile, the figure for Asia and other nations experienced an upward trend in a different pattern. The rate for the former climbed steadily from just under 4% to exactly 15% throughout the stage. In the case of other countries, they stood at 11% in the beginning year, and regardless of a slow went down in the first decade, it increased gradually in 2006 peaking at 14% before falling slightly to 13%, ultimately.
In contrast, Australian people’s birth rate in the U.K plunged until 2001, finishing at precise 5%.
Word Count: 198
