Our system will evaluate the answer based on this AI-generated description.
The image is a bar chart with eight bars, representing the percentage of the total US population aged 65 and over between 1900 and 2000, at ten-year intervals. Among all bars, three age groups are represented by segmented colors in each bar: 65-74, 75-84, and 85+. In 1900, 65-74 was 3.1%, 75-84 was 0.2%, and 85+ was 0.01%. In 1910, 65-74 was 3.2%, 75-84 was 0.3%, and 85+ was 0.02%. In 1920, 65-74 was 3.5%, 75-84 was 0.4%, and 85+ was 0.02%. In 1930, 65-74 was 4.1%, 75-84 was 0.6%, and 85+ was 0.03%. In 1940, 65-74 was 4.5%, 75-84 was 0.7%, and 85+ was 0.04%. In 1950, 65-74 was 5.0%, 75-84 was 1.0%, and 85+ was 0.07%. In 1960, 65-74 was 6.0%, 75-84 was 1.4%, and 85+ was 0.1%. In 1970, 65-74 was 7.1%, 75-84 was 2.0%, and 85+ was 0.2%. In 1980, 65-74 was 8.3%, 75-84 was 2.7%, and 85+ was 0.4%. In 1990, 65-74 was 9.6%, 75-84 was 3.4%, and 85+ was 0.7%. In 2000, 65-74 was 10.1%, 75-84 was 3.5%, and 85+ was 1.2%. Overall, the trend shows an increase in the percentage of the population aged 65 and over, with significant growth in the older age groups, especially 85+.
Given the complexity of the image, the above description may not be entirely accurate.
Skyrocket your IELTS band score by 1-2 points in under a month with our premium plan!
Note: Both the topic and the answer were created by one of our users.
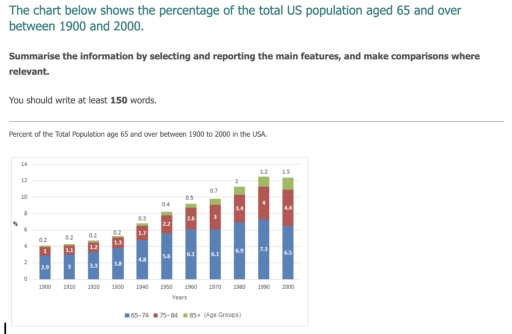
The given chart illustrates information about the total percentage of the USA population aged 65 and over between the two time period, fron 1990 to 2000.
Overall, there are three age groups that’s number had been increasing over the decades. Excluding the one group that’s age is from 65 to 74.
The percentage of people who’s age was in th age group from 65-74 had been steadily increasing until 2000. In the 1900 the percentage of this age group was 2.9%, in 1910 was 3%. Additionally, in 1940 and 1960 it showed 4.8% and 5.6% respectively. Importantly, in 1960s and 1990s it stepped to more than 6% and more than 7% respectively. However, after that it dropped to 6.5% in 2000.
Besides that, the age group 75-84 was only 1% in 1900. Increased to more than 2% only in 1950s. Additionally, reached 3% and 4% in 1970 and 1990 respectively. The percentage reached to 4.4% in 2000. 85+ age group on the other hand, is the lowest percentage among three groups. Their percentage startef from 0.2% in 1900, and remained stable until 1940. However, reached to 1% in 1980 ans 1.5% in 2000.
Word Count: 193