Our system will evaluate the answer based on this AI-generated description.
The image shows a bar graph of coffee and tea buying and drinking habits in five Australian cities: Sydney, Melbourne, Brisbane, Adelaide, and Hobart. The graph compares three categories: bought fresh coffee in the last 4 weeks, bought instant coffee in the last 4 weeks, and went to a café for coffee or tea in the last 4 weeks. In Sydney, 45% of respondents bought fresh coffee, 40% bought instant coffee, and 60% went to a café. In Melbourne, 40% bought fresh coffee, 45% bought instant coffee, and 60% went to a café. In Brisbane, 35% bought fresh coffee, 35% bought instant coffee, and 55% went to a café. In Adelaide, 40% bought fresh coffee, 40% bought instant coffee, and 50% went to a café. In Hobart, 30% bought fresh coffee, 35% bought instant coffee, and 65% went to a café. Overall, going to a café was the most popular option across all cities, with the highest percentage in Hobart. Buying fresh coffee was least popular in Hobart, while buying instant coffee had relatively similar percentages across all cities.
Given the complexity of the image, the above description may not be entirely accurate.
Skyrocket your IELTS band score by 1-2 points in under a month with our premium plan!
Note: Both the topic and the answer were created by one of our users.
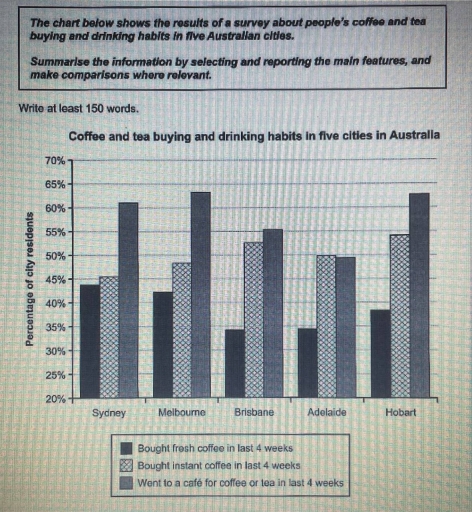
The bar chart illustrates information regarding the percentages of resident’s buying and drinking habits of coffee and tea dividing into three categories such as fresh and instant coffee and those who went to café from the result of a survey in five cities of Australia.
Overall, we can observe that people bought more fresh coffee in all five cities, with slight decrease in Adelaide.Whereas, instant coffee purchasers was highest in Brisbane and lowest in Sydney. Lowest percentage of residents to café for coffee and tea.
Turning to the details, a higher percentage fresh coffee in Melbourne around 63% followed by 62% in Hobart .However, Adelaide showed lowest percentage among all cities for fresh coffee at 49%.While the second category instant coffee remained highest in Hobart at 54% , in Brisbane it was 2% lower In other cities figures indicate the decline in buying of instant coffee in last 4 weeks.The percentage of people who visited café was highest in Sydney about 43%,while Brisbane and Adelaide accounted same percentage of residents indicating 34% .
Word Count: 173