Our system will evaluate the answer based on this AI-generated description.
The image shows a bar graph comparing coffee and tea buying and drinking habits in five Australian cities: Sydney, Melbourne, Brisbane, Adelaide, and Hobart. The y-axis represents the percentage of city residents, ranging from 0% to 70%. Each city has three bars representing the percentage of residents who bought fresh coffee, bought instant coffee, or went to a café for coffee or tea in the last four weeks. In Sydney, around 65% bought fresh coffee, 50% bought instant coffee, and 60% went to a café. In Melbourne, approximately 55% bought fresh coffee, 45% bought instant coffee, and 55% went to a café. Brisbane had around 50% for fresh coffee, 42% for instant coffee, and 38% for café visits. In Adelaide, about 45% bought fresh coffee, 38% bought instant coffee, and 40% went to a café. Lastly, Hobart had nearly 60% for fresh coffee, 40% for instant coffee, and 50% for café visits.
Given the complexity of the image, the above description may not be entirely accurate.
Skyrocket your IELTS band score by 1-2 points in under a month with our premium plan!
Note: Both the topic and the answer were created by one of our users.
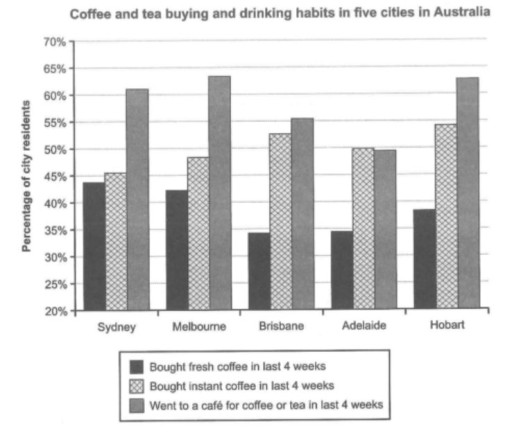
The bar chart describes the findings of a survey about residents’s coffee and tea purchasing and consumptioning behaviour in Sydney, Melbourne, Brisbon, Adelaide and Habart.
It is obivious that Sydney, Melbourne, Brisbon and Habart are the highest precentage of going to a cafe for coffee or tea in last 4 weeks except for Adelaide. The data of people buying instant coffee was higher than that of those buying fresh coffee over the past 4 weeks.
First, the percentage of people buying coffee or tea was higher than that of those going to. The percentage of people buying instant coffee stood at 50% and the fresh coffee is at 40%. Moreover, the percentage of people buying was slighty higher than that of those going to the cafe, at around 60%. Second, 60% of residents in Sydney had the habit of going to a cafe. Furthermore, a large proportion went to a cafe for coffee or tea in last 4 weeks in Sydney, which was slightly higher than that of Brisban.
It was recorded in the survey that a vast majority of going to a cafe inn Adelaide was lower than other 4 cities. The percentage of people going to a cafe in Melbourne was higher after Hobart.
Word Count: 206
