Our system will evaluate the answer based on this AI-generated description.
The image presents a bar chart detailing US household expenditure (in billions) from 2000 to 2007 across three categories: Groceries, Electricity, and Internet. In 2000, Groceries reached nearly $60 billion, Electricity around $30 billion, and Internet approximately $5 billion. In 2001, Groceries remained at about $60 billion, Electricity slightly below $40 billion, and Internet slightly above $5 billion. By 2002, Groceries were close to $60 billion, Electricity around $40 billion, and Internet under $10 billion. In 2003, Groceries again near $60 billion, Electricity just above $40 billion, and Internet just above $10 billion. In 2004, Groceries maintained at about $60 billion, Electricity just under $50 billion, and Internet about $15 billion. 2005 saw Groceries still near $60 billion, Electricity at roughly $50 billion, and Internet nearing $20 billion. In 2006, Groceries close to $60 billion, Electricity just over $50 billion, and Internet slightly below $20 billion. By 2007, Groceries were around $60 billion, Electricity slightly over $50 billion, and Internet close to $20 billion.
Given the complexity of the image, the above description may not be entirely accurate.
Skyrocket your IELTS band score by 1-2 points in under a month with our premium plan!
Note: Both the topic and the answer were created by one of our users.
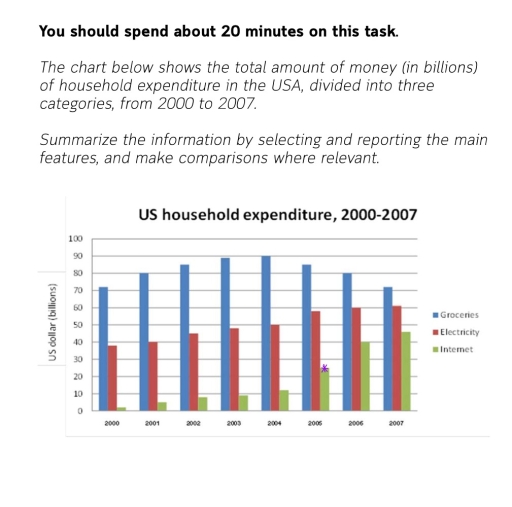
The give bar chart illustrates the information about the money spent by US recipients on different types of household expenditure, during 2000 to 2007.
It can be seen clearly that the expenditure on Groceries was the highest throughout the period, rising from about 70 billion US dollar in 2000 to just under 90 billion in 2003. After peaking at 90 billion the following year, this expense had fallen back as same trend in 2000 figure 2007.
In addition, spending on electricity rose steadily from 38 billion in 2000 to 50 billion in 2004. The years after that rose considerably about 58 billion but in 2006 and 2007 was constant at 60 billion. While the consumption of internet rose gently by started around 2 billion in 2000 until just under 8 billion in 2003 and rose slightly around 12 billion in 2004, but dramatic increase in 2006 goes to about 25 billion then the following years was rose steadily in 2006 to 2007
Word Count: 162
