Our system will evaluate the answer based on this AI-generated description.
The image is a bar graph and a table depicting export earnings from 2015 to 2016. The bar graph shows 5 product categories: Petroleum products, Engineered goods, Gems and jewellery, Agricultural products, and Textiles. For 2015 and 2016, Petroleum products earn approximately $60 billion and $58 billion respectively, Engineered goods earn approximately $50 billion and $54 billion respectively, Gems and jewellery earn about $42 billion and $38 billion respectively, Agricultural products earn roughly $22 billion and $22 billion respectively, and Textiles earn around $18 billion and $20 billion respectively. The table below the bar graph shows the percentage change in values from 2015 to 2016 for each category: a 3% decrease for Petroleum products, an 8.5% increase for Engineered goods, a 5.18% decrease for Gems and jewellery, a 0.81% increase for Agricultural products, and a 15.24% increase for Textiles.
Given the complexity of the image, the above description may not be entirely accurate.
Skyrocket your IELTS band score by 1-2 points in under a month with our premium plan!
Note: Both the topic and the answer were created by one of our users.
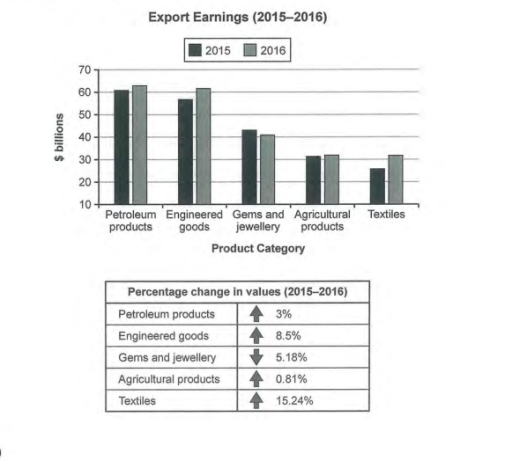
The figure illustrates the amount of the changed percentage and comparison of exports in various fields include (petroleum products, engineered goods, Gems and Jewelry, Agricultural products, and textiles) over the time between 2015 and 2016. units measured is billion dollars.
Overall, Although a maximum growth of .24 in 2016 happened in textiles, this category ranked at a minimal position in the table. Meanwhile, high exported value allocates to Petroleum products.
Regards to Petroleum products, that changed minimally with %3 and it rose from $60 billion to nearly $63 billion between 2015 and 2016. Engineered goods growth %8.5 from about $58 in 2015 to nearly $64 in 2016. This category shows as the second valuable category in the table.
In terms of Gem and Jewelry, the diagram shows a meaningful decline with %5.18 and the export earnings went down from nearly $53 to $50 between 2015 and 2016. Agricultural products approximately stayed constant with minimal change. It rose from about $43 to $44 from 2015 to 2016. Textiles had a significant jump with .24 in 2016 and it rose from under $40 to upper $42 from 2015 to 2016.
Word Count: 188