Our system will evaluate the answer based on this AI-generated description.
The image is a bar graph and a table depicting export earnings from 2015 to 2016. The bar graph shows 5 product categories: Petroleum products, Engineered goods, Gems and jewellery, Agricultural products, and Textiles. For 2015 and 2016, Petroleum products earn approximately $60 billion and $58 billion respectively, Engineered goods earn approximately $50 billion and $54 billion respectively, Gems and jewellery earn about $42 billion and $38 billion respectively, Agricultural products earn roughly $22 billion and $22 billion respectively, and Textiles earn around $18 billion and $20 billion respectively. The table below the bar graph shows the percentage change in values from 2015 to 2016 for each category: a 3% decrease for Petroleum products, an 8.5% increase for Engineered goods, a 5.18% decrease for Gems and jewellery, a 0.81% increase for Agricultural products, and a 15.24% increase for Textiles.
Given the complexity of the image, the above description may not be entirely accurate.
Skyrocket your IELTS band score by 1-2 points in under a month with our premium plan!
Note: Both the topic and the answer were created by one of our users.
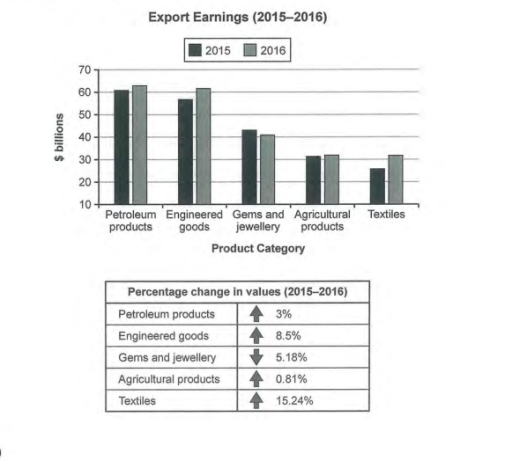
The chart provides the export earnings in five categories of a country, in 2015 and 2016. In addition, the table shows the percentage changes in values of each category in 2016 compared with 2015.
Overall, most of these products were increased over the period except Germs and jewellery. This category was slightly decreased in 2016 compared with 2015.
The most valuable category was Petroleum products, which earned about 60 billions dollars in 2015 and increased 3% in value in 2016. The second valuable product was Engineered goods, which increased 8.5% in value over one year.
Gems and jewellery, Agricultural products, and Textiles are three categories that had export values under 50 billions dollars. Specifically, Gems and jewelly was the only category that was decreased in value, by 5.18%. At the same time, Agricultural products was slightly increased, by 0.81%, while Textiles was dramatically increased, by 15.24%.
Word Count: 146