Our system will evaluate the answer based on this AI-generated description.
The image depicts a bar graph illustrating British emigration to selected destinations between 2004-2007, with thousands on the y-axis and destination countries on the x-axis. Each country has four bars representing the years, with blue for 2004, red for 2005, green for 2006, and yellow for 2007. Australia had the highest emigration numbers, starting around 50,000 in 2004, decreasing steadily each year to just over 30,000 in 2007. Spain's numbers ranged from just over 40,000 in 2004 to around 35,000 in 2007. New Zealand saw a consistent decrease from just over 20,000 in 2004 to around 10,000 in 2007. The USA had an increase from 20,000 in 2004 to nearly 30,000 in 2006 before dropping to around 20,000 in 2007. France's numbers remained relatively stable, starting at just over 10,000 in 2004, peaking at around 15,000 in 2005, and settling at just under 10,000 in 2007. The data source is the International Passenger Survey/ONS.
Given the complexity of the image, the above description may not be entirely accurate.
Skyrocket your IELTS band score by 1-2 points in under a month with our premium plan!
Note: Both the topic and the answer were created by one of our users.
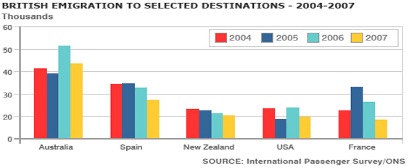
The given data displays countries, where population of UK settled down during 4 years.
Overall, the most common destinations wore moving were Australia, Spain, New Zeleand and France. In addition, Australia was on the peak of popularity in period, from 2004 to 2007. Although, British also emigrated in neighbour countries, such as Spain and France.
At first glance, Australia is the most typical country for emigration, due to the number of British, who settled down to there at the beginning of period accounted for just over 40 thousands, however in 2006 indicator is on the peak and composed around 50 thousands, but earlier this quantity was much less. Although, in 2007 parameter is decreasd and was just around 45 thousand of people.
On the one hand, the situation with other ones is strongly different, because in the case of Spain and New Zealand, indicators were diminishing and accounted for 35 and 25 at the beginning, 28 and 20 at the end, respectively. On the other hand, The number of individuals, who immigrate to USA fluctuate during given time , it was same in 2004 and 2006 around, also in 2005 and 2007 it composed about 20 thosands. France was famous in 2005 and aws 35 thosand, budt slightly decreases and was 18 at the end.
Word Count: 215