Our system will evaluate the answer based on this AI-generated description.
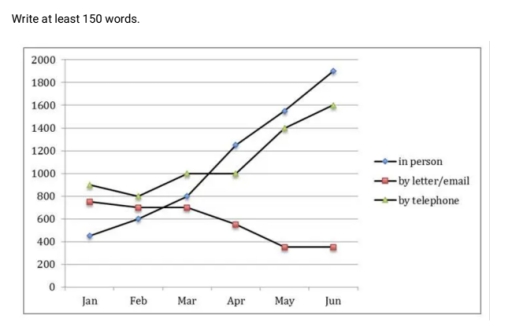
The image contains a line graph depicting the frequency of three types of communication— in person, by letter/email, and by telephone— over six months from January to June. In January, in person stands at 450, by letter/email at 800, and by telephone at 900. In February, in person rises to 600, by letter/email remains 700, and by telephone drops to 700. In March, in person increases to 1000, by letter/email slightly falls to 600, and by telephone moves upward to 1000. In April, in person surges to 1400, by letter/email drops to 500, and by telephone peaks at 1200. In May, in person continues upward to 1600, by letter/email reduces further to 400, and by telephone slightly decreases to 1400. In June, in person peaks at 1900, by letter/email dips to 400, and by telephone garners 1600. All values are recorded monthly, showcasing trends in communication methods.
Given the complexity of the image, the above description may not be entirely accurate.
Skyrocket your IELTS band score by 1-2 points in under a month with our premium plan!
Note: Both the topic and the answer were created by one of our users.
The chart shows requests for information at a tourist office in United Kingdom from January to June 2003.
Overall, there was a steady growth of the number who asked in person and by telephone, while the number of people who asked by letter or email was rose sharply.
Regarding in January there was 400 in the number of information requests in person, followed by the people who asked information by telephone at 900. Five months later, the number of people who asking in person was grew significantly, which reach at 1900, while the number of asking by telephone are the second at 1600.
In contrast the number of number for request by letter or email was 800 in the starting, as well as, it rose rapidly which hit a lowest point at 400 in five months later.
Word Count: 137
