Our system will evaluate the answer based on this AI-generated description.
The image is a line graph representing the number of requests for information at a tourist office in the United Kingdom, from January to June, with three lines corresponding to different modes of request - in-person, by letter/email, and by telephone. In January, in-person requests numbered 400, letter/email requests were 200 and telephone requests were at 600. In February, in-person requests increased to 600, letter/email requests decreased to 150, and telephone requests remained at 600. In March, in-person requests reached 800, letter/email requests were at 300, and telephone requests climbed to 1000. In April, in-person requests increased to 1200, letter/email requests remained at 300, and telephone requests were at 1400. In May, the in-person requests reached the highest number at 1600, letter/email requests rose to 350, and telephone requests also peaked at 1800. Finally, in June, the in-person requests decreased slightly to 1500, letter/email requests dropped to 300, and telephone requests also decreased to 1700.
Given the complexity of the image, the above description may not be entirely accurate.
Skyrocket your IELTS band score by 1-2 points in under a month with our premium plan!
Note: Both the topic and the answer were created by one of our users.
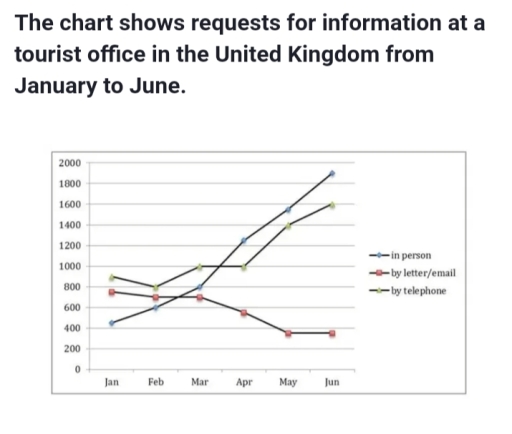
The line graph give information about the information for requests at a tourist office in the United Kingdom between january and June.
Overall, it can be seen that the highest request information at a tourist office in person and by telephone follow. While by latter/email request for information at a tourist office it had steady decrease over the period.
In the initial time, the request for information at a tourist office in person rate account for 400 and it rose significantly to 1900 in next five months . While information for requests at a tourist office by telephone stood at 800 in the January but it has slightly increase at 1000 in March. Although next three months it had gradually increase noted at 1600.
Moreover, a lowest description of 400 is evident in terms of request for information at a tourist office by latter/email rate between January and June, as in the former month it was 800 in contrast the latter month represented 400.
Word Count: 164