Our system will evaluate the answer based on this AI-generated description.
The image is a line graph representing the number of requests for information at a tourist office in the United Kingdom, from January to June, with three lines corresponding to different modes of request - in-person, by letter/email, and by telephone. In January, in-person requests numbered 400, letter/email requests were 200 and telephone requests were at 600. In February, in-person requests increased to 600, letter/email requests decreased to 150, and telephone requests remained at 600. In March, in-person requests reached 800, letter/email requests were at 300, and telephone requests climbed to 1000. In April, in-person requests increased to 1200, letter/email requests remained at 300, and telephone requests were at 1400. In May, the in-person requests reached the highest number at 1600, letter/email requests rose to 350, and telephone requests also peaked at 1800. Finally, in June, the in-person requests decreased slightly to 1500, letter/email requests dropped to 300, and telephone requests also decreased to 1700.
Given the complexity of the image, the above description may not be entirely accurate.
Skyrocket your IELTS band score by 1-2 points in under a month with our premium plan!
Note: Both the topic and the answer were created by one of our users.
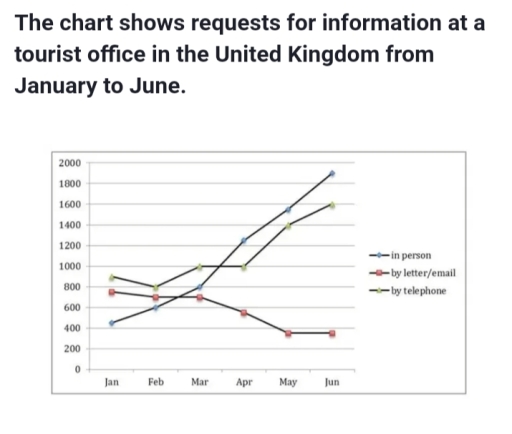
The aforementioned line graph illustrates the number of tourists in the UK requesting information in various ways. It is categorized into 3 categories – in person, by email or letter and by telephone. The months being compared are between January to June.
Overall, it is evident that there are many fluctuations in the graph. There has been a continuous rise in the amount of tourists seeking information through telephone and in person. The number of visitors requesting information by these modes of communication peaked in June, with approximately 1600 and 1880 people, respectively.
However, requesting information by letter or email has anomalous data. There has been a continuous decrease in the quantity of people, with the lowest in June, at 590 people. Moreover, it had the highest number of inquiries in January at around 790 guests.
In contrast, January and February had the least amount of inquiries by person and telephone, with an estimate of 440 and 800 guests, respectively. Between March to May, these modes of communication faced an upsurge of customers while requests by forms of written communication faced a downsurge.
Word Count: 183