Our system will evaluate the answer based on this AI-generated description.
The image is a line graph representing the number of requests for information at a tourist office in the United Kingdom, from January to June, with three lines corresponding to different modes of request - in-person, by letter/email, and by telephone. In January, in-person requests numbered 400, letter/email requests were 200 and telephone requests were at 600. In February, in-person requests increased to 600, letter/email requests decreased to 150, and telephone requests remained at 600. In March, in-person requests reached 800, letter/email requests were at 300, and telephone requests climbed to 1000. In April, in-person requests increased to 1200, letter/email requests remained at 300, and telephone requests were at 1400. In May, the in-person requests reached the highest number at 1600, letter/email requests rose to 350, and telephone requests also peaked at 1800. Finally, in June, the in-person requests decreased slightly to 1500, letter/email requests dropped to 300, and telephone requests also decreased to 1700.
Given the complexity of the image, the above description may not be entirely accurate.
Skyrocket your IELTS band score by 1-2 points in under a month with our premium plan!
Note: Both the topic and the answer were created by one of our users.
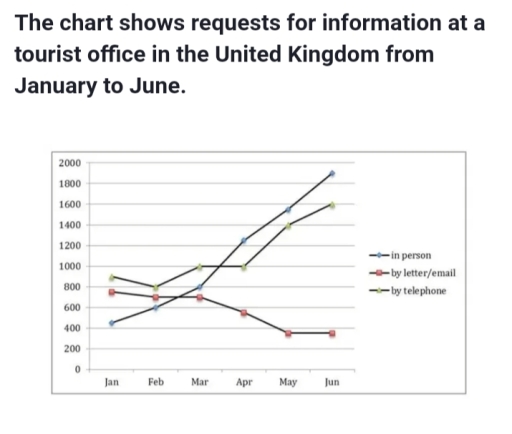
The line chart illustrates data about the number of information requests at a British tourist office over the period of 6 months.
Overall, it is apparent that the number of people who asked for information in person increased gradually, while requests made by telephone showed an upward trend although the figure experienced a period of volatility. In contrast, the number of requests made by emails fell moderately.
To begin, the figure for in person inquiries accounted for just over 400 in January, then nearly doubled to 800 by March. By April it rose substantially to approximately 1200 before reaching its final value of 1900 at the end of the given period. Conversely, the number of people asking for information by letters constituted just below 800 in the first month and decreased minimally to nearly 700 in March. Subsequently, the frequency of email inquiries dropped to just below 400 by May and remained relatively unchanged until the end of the period.
Regarding the number of requests by telephone, it allocated 900 at the start of the period and fell slightly to 800 in the following month. In March the figure grew modestly to 1000 and levelled off for the next month. Then, telephone inquiries rose substantially to 1400 by May before reaching its peak of 1600 at the end of the given timespan.
Word Count: 222