Our system will evaluate the answer based on this AI-generated description.
The image contains two bar graphs, one representing data from 1996 and the other from 2008, depicting the age when getting married by age group, divided by gender (Female/Male). In 1996, for age group 16-19, females had a percentage around 12%, while males were just above 2%; for 20-24, females were just above 8%, males around 6%, for 25-29, females were just under 6%, males just under 4%; for 30-34, females were around 4%, males just over 2%; for 35-39, females were just under 2%, males just above 0%; for 40-44, females were around 0%, males around 0%. In 2008, for age group 16-19, females had a percentage around 2%, while males were around 0%; for 20-24, females were around 6%, males around 4%; for 25-29, females were above 10%, males around 6%; for 30-34, females were under 14%, males around 8%; for 35-39, females were around 6%, males around 4%; for 40-44, females and males were around 2%.
Given the complexity of the image, the above description may not be entirely accurate.
Skyrocket your IELTS band score by 1-2 points in under a month with our premium plan!
Note: Both the topic and the answer were created by one of our users.
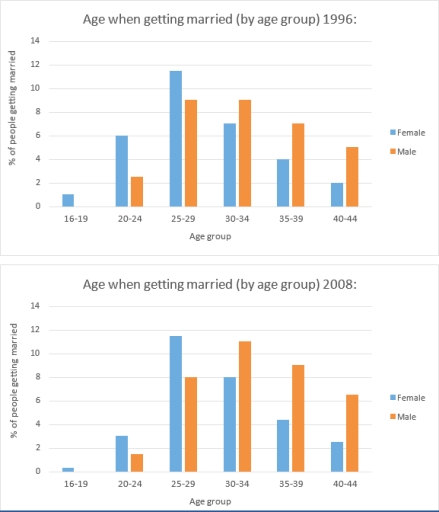
The bar charts illustrated the ages at which men and women got married in a particular nation between 1996 and 2008.
According to the chart, it is clear that people tended to marry at older ages in 2008 than in 1996. In both years, women generally married younger than men, and the most common age group for marriage was 25-29.
In 1996, the highest proportion of women married between the ages of 25 and 29, at about 12%. This was followed by those aged 30-34, at around 7%. Very few women married before the age of 20 or after 40. For men, the peak age for marriage was also 25-29, though at a lower figure of approximately 9%. A significant number of men married later, with around 7% in the 35-39 group and about 6% aged 40-44.
By 2008, marriage had shifted towards older age groups for both genders. The proportion of women marrying at 25-29 remained the highest, at roughly 12%, but there was a noticeable increase in the 30-34 and 35-39 categories. Among men, the most dramatic change was seen in the 35-39 age group, which rose to about 12%, becoming the most common age for male marriage. The figures for men aged 30-34 also increased, while marriages under the age of 25, declined for both genders.
Word Count: 219
