Our system will evaluate the answer based on this AI-generated description.
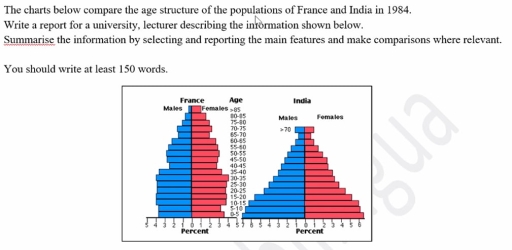
The image presents two comparative histogram-like charts detailing the population age structure of France and India in 1984, segmented by gender. For France, each age bracket from 0-4 through 80-85 reflects percentages for males and females; for 0-4 years, males at ~3.2%, females at ~3.0%; for 5-9 years, males ~3.0%, females ~2.8%; for 10-14 years, males ~2.8%, females ~2.8%; for 15-19 years, males ~3.0%, females ~3.0%; for 20-24 years, males ~3.0%, females ~3.4%; for 25-29 years, males ~3.0%, females ~3.6%; for 30-34 years, males ~3.0%, females ~3.6%; for 35-39 years, males ~3.0%, females ~3.2%; for 40-44 years, males ~3.0%, females ~3.0%; for 45-49 years, males ~2.8%, females ~3.0%; for 50-54 years, males ~2.8%, females ~2.8%; for 55-59 years, males ~2.6%, females ~2.8%; for 60-64 years, males ~2.2%, females ~2.4%; for 65-69 years, males ~1.8%, females ~2.2%; for 70-74 years, males ~1.4%, females ~2.0%; for 75-79 years, males ~0.8%, females ~1.6%; for 80-85 years, males ~0.6%, females ~1.4%. In India, age group data signify males and females for age 0-4 at ~7.0%, age 5-9 at ~6.8%, age 10-14 at ~6.2%, age 15-19 at ~5.6%, age 20-24 at ~5.0%, age 25-29 at ~4.4%, age 30-34 at ~3.8%, age 35-39 at ~3.4%, age 40-44 at ~2.8%, age 45-49 at ~2.4%, age 50-54 at ~2.0%, age 55-59 at ~1.6%, age 60-64 at ~1.4%, age 65-69 at ~1.0%, and >70 years at ~2.0%.
Given the complexity of the image, the above description may not be entirely accurate.
Skyrocket your IELTS band score by 1-2 points in under a month with our premium plan!
Note: Both the topic and the answer were created by one of our users.
The diagrams illustrate the comparison of the inhabitant age distribution of France and India in 1984. As can be seen from the graph, the fluctuation of French denizens was quite obscure while young people dominate more than the elderly in India.
In France, the age group which had the highest resident (about 4%) was the 30-35 one. In the groups from 0-5 to 25-30, the number of boys was the same for every 2 groups but a constantly changing trend in girls. Although The dispensation of both genders was insignificant, ladies still prevailed in the older age group (from 60 to over 85).
Moreover, the age composition of the Indian looked like a pyramid. People who belong to the 0 to 5 age group that was the most percentage (7%) and they were twice as many as 30-35 years old people. Subsequently, the higher the age was, the less Indian citizens were. However, it just dipped minimally approximately 0,5 percent, and went below 1% at 65-70 years old. Despite a steady decline, there was a rapid increase after the age of 70.
Word Count: 182
