🔥 Today Only: Save 30% on Premium — Offer Ends Soon! - Upgrade Now!
Multiple Graphs

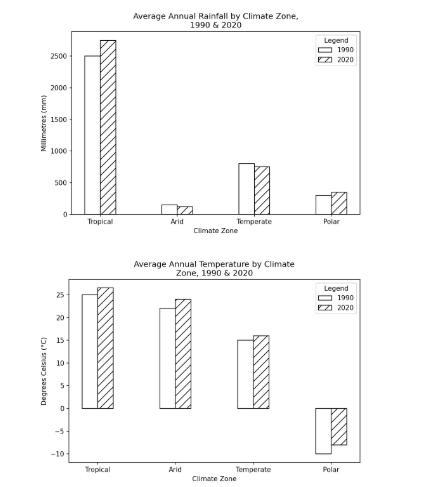
Band 6+: The charts below show the average annual rainfall and temperature in four different climate zones for the years 1990 and 2020. Summarise the information by selecting and reporting the main features, and make comparisons where relevant.

Image for topic: The charts below show the average annual rainfall and temperature in four different climate zones for the years 1990 and 2020. Summarise the information by selecting and reporting the main features, and make comparisons where relevant.
Our system will evaluate the answer based on this AI-generated description.
The image features two vertical bar charts. The top chart, titled "Average Annual Rainfall by Climate Zone, 1990 & 2020", has a y-axis labeled "Millimetres (mm)" (ranging from 0 to 2500 in increments of 500) and an x-axis labeled "Climate Zone" with four categories: Tropical, Arid, Temperate, and Polar. A legend identifies two series: 1990 and 2020. Values for 1990 and 2020 are: Tropical at 2500 mm (1990) and 2750 mm (2020); Arid at 150 mm (1990) and 125 mm (2020); Temperate at 800 mm (1990) and 750 mm (2020); Polar at 300 mm (1990) and 350 mm (2020). The bottom chart, titled "Average Annual Temperature by Climate Zone, 1990 & 2020", has a y-axis labeled "Degrees Celsius (°C)" (ranging from -10 to 25 in increments of 5) and an x-axis labeled "Climate Zone" containing Tropical, Arid, Temperate, and Polar. The legend distinguishes 1990 and 2020. Values for 1990 and 2020 are: Tropical at 25 °C (1990) and 26.5 °C (2020); Arid at 22 °C (1990) and 24 °C (2020); Temperate at 15 °C (1990) and 16 °C (2020); Polar at -10 °C (1990) and -8 °C (2020).
Given the complexity of the image, the above description may not be entirely accurate.
Note: Both the topic and the answer were created by one of our users.

The charts illustrate the average yearly precipitation and temperature in four different climate areas, namely, Tropical, Arid, Temprate and Polar in 1990 and 2020.

Overall, Tropical zone reported the heaviest rainfall in both years, whereas Arid area recieved the lowest precipitation. However, the annual temperature were almost similar in Tropical and Arid zones, while in polar region it went down to negative figure, making it the coldest among other zones.

Notably, Tropical region experinced highest rainfall at 2,500 mm in 1990, while it recieved slightly higher rainfall in the recent year. In Temperate zone, the precipition was almost similar in both years. Although, in polar region the rainfall has increased marginally while comparing in both years. Arid zone faced the lowest rainfall figures when compared to other zones.

Meanwhile, in both Tropical and Arid zones were experienced a marginal rise in the temperature, while Tropical region is warmer than Arid. Likewise, Temprerate zone recorded 15 degree celsius temperature in 1990, which increased a little in 2020. Although, in polar area the temperature went down to -10 degree celsius in 1990, and became slighlty warmer in 2020.

Word Count: 186

Other Topics:

The charts below show the amount of greenhouse gas emissions by sector for the European Union and China in the years 2000 and 2020. Summarise the information by selecting and reporting the main features, and make comparisons where relevant.

The bar graphs compare the greenhouse gas emissions (in million tonnes of CO2) across four sectors of the European Union (EU) and China in 2000 and 2020. Overall, in 2000, the emission levels of both countries are relatively similarly. However, after 20 years, China’s emissions skyrocketed while the EU managed to curb them, resulting in […]

The pie charts show the main reasons for migration to and from the UK in 2007. Summarize the information by selecting and reporting the main features and make comparisons where relevant.

The given pie charts provide information about some prevalent reasons for migration from and to the UK in 2007. Overall, it is evident that people immigrate and emigrate mainly for definite job, accounting for the highest proportion for both purposes. No reason stated made up the lowest share among immigrants, whereas formal study constituted the […]

The bar charts show the percentage of films released and corresponding ticket sales. Summarise the information by selecting and reporting the main features, and make comparisons where relevant.

The bar charts illustrate the proportion of film production and the sales of cinema tickets in different categories – drama, comedy, fantasy, and romance from 1996 to 2000. Overall, each category of films experienced different trends. While the percentage of drama production was the highest, the percentage of ticket sales was the highest in the […]

Task 1 question about the police budget for 2017 and 2018

The table and charts provide information about the police budget in one area of Great Britain in 2017 and 2018. The table gives details about where the money came from, while the charts illustrate how it was spent. Overall, the total police budget slightly increased in 2018. The national government remained the bigest source of […]

The pie charts below show the percentage of 5 kinds of books sold by a bookseller between 1972 and 2012.

The pie charts illustrates the percentage of five kinds of books sold by bookseller between 1972 and 2012 Overall, at 1912 its very balanced out between all type of books except for travel books which got 15% and other kind of books which got 25%. Meanwhile at 1992, adult fiction rose by 5% which makes […]

Average percentages of sodium, saturated fats anadded sugars in typical meals consumed in the USA

The pie charts illustrate the average consumption of sodium, saturated fat, and added sugar by meal. All three types of nutrients might be harmful to health if they are over-consumed. Overall, while the intake of sodium and saturated fat is higher at dinner time than at any other time of the day,and added sugar was […]

See All
We have detected unusual activity on your device.
Please verify your identity to continue.
Note: This verification step won't sign you in. If you have a premium account, please log in to access the service as usual.
Google/Gmail Verification
Or verify using Email/Code
We've sent a verification code to:
youremail@gmail.com (Not your email?)
Enter it below to complete the verification process.
Ensure your email address is correct, your inbox is not full, and you check your spam folder. If no email arrives, consider using an alternative email.
You will need a Premium plan to perform your action!
Note: If you already have a premium account, please log in to access our services as usual.

Plans & Pricing

Our mission is to make quality education accessible for everyone.
However, to keep our hardworking team running and this service alive, we genuinely need your support!
By opting for a premium plan, not only do you sustain us in achieving the mission, but you also unlock advanced features to enrich your learning experience.

Free

For learners who aren't pressed for time

What's included on Free
100+ Cambridge IELTS Tests
Instant IELTS Writing Task 1 & 2 Evaluation (2 times/month)
Instant IELTS Speaking Part 1, 2, & 3 Evaluation (2 times/month)
Instant IELTS Writing Task 1 & 2 Essay Generator (2 times/month)
500+ Dictation & Shadowing Exercises
100+ Pronunciation Exercises
Flashcards
Other Advanced Tools

Premium

For those serious about advancing their English proficiency, and for IELTS candidates aspiring to boost their band score by 1-2 points (especially in writing & speaking) in just 30 days or less

What's included on Premium
Save Your IELTS Test Progress & Analyze Mistakes By Question Type
Unlock All Courses, IELTS Tests, Section & Part Practice
Unlimited AI Conversations
Unlimited AI Writing Enhancement Exercises
Unlimited IELTS Writing Task 1 & 2 Evaluation
Unlimited IELTS Speaking Part 1, 2, & 3 Evaluation
Checked Answers Will Not Be Published
Unlimited IELTS Writing Task 1 & 2 Essay Generator
Unlimited IELTS Speaking Part 1, 2, & 3 Sample Generator
Unlimited Usage Of Advanced Tools & AI Features
Priority Support within 24h (12-month plan only)

Due to the nature of our service and the provided free trials, payments are non-refundable.
Nếu bạn là người Việt Nam và không có hoặc không muốn trả bằng credit/debit cards, bạn có thể thanh toán bằng phương thức chuyển khoản:


Chọn gói:
419,000₫ 277,000 ₫ cho gói 1 tháng (chỉ 9,233₫/ngày)
1,239,000₫ 597,000 ₫ cho gói 3 tháng (chỉ 6,633₫/ngày)
2,469,000₫ 1,027,000 ₫ cho gói 6 tháng (chỉ 5,706₫/ngày)
4,929,000₫ 1,417,000 ₫ cho gói 12 tháng (chỉ 3,936₫/ngày)


Sau khi chuyển khoản, vui lòng đợi trình duyệt tự động điều hướng bạn trở lại Engnovate và bạn sẽ ngay lập tức nhận được mã kích hoạt tài khoản premium.
Nếu có lỗi xảy ra, bạn có thể liên hệ với team thông qua một trong các phương thức: email đến helloengnovate@gmail.com hoặc nhắn tin qua facebook.com/engnovate.
Vì toàn bộ công cụ trên website đều có thể sử dụng thử miễn phí, Engnovate không hỗ trợ hoàn tiền.