🔥 Today Only: Save 30% on Premium — Offer Ends Soon! - Upgrade Now!
Bar Chart

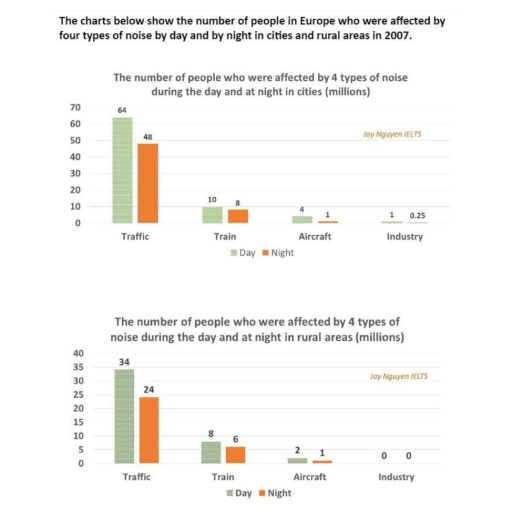
Band 4+: The charts below show the number of the people in Europe who were effected by four types of noise by day and by night in cities and rural areas in 2007.

Image for topic: The charts below show the number of the people in Europe who were effected by four types of noise by day and by night in cities and rural areas in 2007.
Our system will evaluate the answer based on this AI-generated description.
The image shows two vertical bar charts comparing the impacts of noise from traffic, trains, aircraft, and industry during the day and night on millions of people in Europe in 2007, segmented between cities and rural areas. The first chart, "The number of people who were affected by 4 types of noise during the day and at night in cities (millions)", shows the following daytime noise levels: Traffic 64 million, Train 10 million, Aircraft 4 million, Industry 1 million, and nighttime noise levels: Traffic 48 million, Train 8 million, Aircraft 1 million, Industry 0.25 million. The second chart, "The number of people who were affected by 4 types of noise during the day and at night in rural areas (millions)", shows the following daytime noise levels: Traffic 24 million, Train 6 million, Aircraft 2 million, Industry 1 million, and nighttime noise levels: Traffic 15 million, Train 1 million, Aircraft 0 million, Industry 0 million.
Given the complexity of the image, the above description may not be entirely accurate.
Note: Both the topic and the answer were created by one of our users.

The bar graph describes the number of in E

urope affected by four People in types of night noise during daytime and in cities and countryside in 2007

In cities, daytime from traffic affected 64 million people, while this number was just 34 million in countryside. At nicht, number of people affected by traffic was 48 million in cities and 24 million in countryside. Moreover, noise pollution by train was less than tratik during daytime number of peaple affected by train was lo million in Cities and 8 million at countryside, where as during night it was 8 million and 6 million respectively. Furthermore, noise pollution caused by aircraft during the daytime in cities and countryside was 4 million and 2 million-During night, numbers were I million for both cities and country. Side However, Countryside areas are mt affected by industry noise, while in citles, people affected at daytime and night are I million and 0.25 million respectively.

Overall, traffic was the main reason of noise pollution at all time. More- over cities are more affected. by noise pollution than countryside.

Word Count: 181

Answers On The Same Topic:

The charts below show the number of the people in Europe who were effected by four types of noise by day and by night in cities and rural areas in 2007.

The bar charts give information about the prevalence of four different types of noise affecting populations in Europe during daytime and nighttime hours in cities and rural areas in 2007. Overall, traffic noise affected by far the largest number of people in both cities and rural areas, while industrial noise had the least impact. In […]

The charts below show the number of the people in Europe who were effected by four types of noise by day and by night in cities and rural areas in 2007.

The pie chart give information about four different types of noice that would affect the people of Europe during the day time and evening time, and this information is represented in 2007. Overall, the chart illustrate that noise polution affected both people who were living in city and also affect countryside people. The first diagram […]

The charts below show the number of the people in Europe who were effected by four types of noise by day and by night in cities and rural areas in 2007.

The bar charts illustrate the information about the number of people in Europe who were affected by four types of noise (traffic, train, aircraft, industry) during the day and at night in cities and rural areas in 2007. Overall, in both situations, traffic had the greatest impact on noise levels during the day and night, […]

The charts below show the number of the people in Europe who were effected by four types of noise by day and by night in cities and rural areas in 2007.

The provided charts below illustrate information on the number of people in European cities and rural areas who were bothered by four types of noise in 2007. Starting with the cities, traffic affected 64 million people during the day and 48 million at night. Other sources were less common. Trains disturbed 10 million individuals in […]

The charts below show the number of the people in Europe who were effected by four types of noise by day and by night in cities and rural areas in 2007.

The bar charts demonstrate information about the number of individuals who were affected by train, traffic, aircraft, and industry by night and by day in urban and rural areas in 2007. Overall, it is noticeable that the number of people who were affected by traffic on a day and night constituted the dominant figures in […]

See All

Other Topics:

British people giving money to charity by a range for the years 1990 and 2010

The bar chart shows the proportion of Britons donating money to charity by age cohorts over the 20-year period. Overall, in the first year, the proportion of charity donators declined among the three younger age groups, whereas it increased among those who aged 51-65 and those over 65. The highest percentages of those who made […]

The bar graph below shows the number of new houses constructed in a certain city from between 1999 and 2002. Summarise the information by selecting and reporting the main features, and make comparisons where relevant.

The bar graph illustrates the number of new houses constructed in a city from 1999 to 2002. Overall, the number of detached houses increased over the period and the number of semi-detached houses decreased. Terrace houses experienced a growth, while the number of flats witnessed a decline with the passage. The number of detached houses […]

The chart below shows the main reasons why agricultural land becomes less productive in three regions of the world. Summarise the information by selecting and reporting the main features, and make comparisons where relevant.

The chart illustrated the importance causes of agriculture’s land becoming less productive in three provinces. overall, all three districts were declining, while Oceania has the highest land, which followed by Europe. Moreover, North America had the lowest land degradation. Plus it can seen that local area and causes, which is over- grazing, deforestation, and over- […]

Michelin stars is a rating system used to grade restaurants on their quality by red Michelin guide every year. The graph represents the countries by number of 3 Michelin star restaurants in November 2017. Summarise the information by selecting and reporting the main features, and make comparisons where relevant.

The bar graph provided data on changes the figure of 3 Michelin star restaurants using grade on their quality in 11 countries in month of November 2017. Overall, among the 11 countries, Japan and France(including Monaco) are dominated in grade on quality of restaurants. Whereas, Belgium and South Koreas experienced less rate given by the […]

The chart below shows the main reasons why agricultural land becomes less productive in three regions of the world. Summarise the information by selecting and reporting the main features, and make comparisons where relevant.

The chart illustrated the importance causes of agriculture’s field becoming less productive in three provinces. In overall, all three districts were declining, while Oceania has the highest land, which followed by Europe. Moreover, North America has the lowest land degradation. To begin with, we can visible that local area and causes, which is over- grazing, […]

The chart below shows the share of total world production in three regions from 1840 to 2000.

The chart illustrates the share of total world production in Asia, Europe, and the rest of world over the period from 1840 to 2000. Overall, it is clear that Europe was taking predominantly a leading position in the total amount, except the beggining and the end. Asia, took the first place initially, however was surpassed […]

See All
We have detected unusual activity on your device.
Please verify your identity to continue.
Note: This verification step won't sign you in. If you have a premium account, please log in to access the service as usual.
Google/Gmail Verification
Or verify using Email/Code
We've sent a verification code to:
youremail@gmail.com (Not your email?)
Enter it below to complete the verification process.
Ensure your email address is correct, your inbox is not full, and you check your spam folder. If no email arrives, consider using an alternative email.
You will need a Premium plan to perform your action!
Note: If you already have a premium account, please log in to access our services as usual.

Plans & Pricing

Our mission is to make quality education accessible for everyone.
However, to keep our hardworking team running and this service alive, we genuinely need your support!
By opting for a premium plan, not only do you sustain us in achieving the mission, but you also unlock advanced features to enrich your learning experience.

Free

For learners who aren't pressed for time

What's included on Free
100+ Cambridge IELTS Tests
Instant IELTS Writing Task 1 & 2 Evaluation (2 times/month)
Instant IELTS Speaking Part 1, 2, & 3 Evaluation (2 times/month)
Instant IELTS Writing Task 1 & 2 Essay Generator (2 times/month)
500+ Dictation & Shadowing Exercises
100+ Pronunciation Exercises
Flashcards
Other Advanced Tools

Premium

For those serious about advancing their English proficiency, and for IELTS candidates aspiring to boost their band score by 1-2 points (especially in writing & speaking) in just 30 days or less

What's included on Premium
Save Your IELTS Test Progress & Analyze Mistakes By Question Type
Save Your Own Flashcard Sets & Use Them On Any Device
Unlock All Courses, IELTS Tests, Section & Part Practice
Unlimited AI Conversations
Unlimited AI Writing Enhancement Exercises
Unlimited IELTS Writing Task 1 & 2 Evaluation
Unlimited IELTS Speaking Part 1, 2, & 3 Evaluation
Checked Answers Will Not Be Published
Unlimited IELTS Writing Task 1 & 2 Essay Generator
Unlimited IELTS Speaking Part 1, 2, & 3 Sample Generator
Unlimited Usage Of Advanced Tools & AI Features
Priority Support within 24h (12-month plan only)

Due to the nature of our service and the provided free trials, payments are non-refundable.