24 Hours Only: Get 20% OFF on Our Premium Plan - Upgrade Now!
Process Diagram

Band 6+: The diagram below shows the water cycle in both forested and urban areas. Summarise the information by selecting and reporting the main features and make comparisons where relevant.

Image for topic: The diagram below shows the water cycle in both forested and urban areas. Summarise the information by selecting and reporting the main features and make comparisons where relevant.
Our system will evaluate the answer based on this AI-generated description.
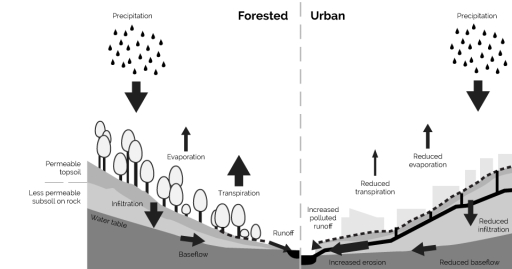
The image presents a comparative graphical depiction of water runoff in forested and urban settings. Both sections of the graph start with precipitation elements at the top. In the forested section, arrows point downward showing "Infiltration" through a "Permeable topsoil" and "Less permeable subsoil on rock" leading to "Water table" and then "Baseflow" with lateral arrows indicating "Evaporation" and "Transpiration" at the tree level, and "Runoff" at surface level. In contrast, the urban section arrows point towards "Reduced transpiration" and "Reduced evaporation" at the building level, with a significant arrow marked "Increased runoff" with side annotation "polluted" leading to "Increased erosion" with a consequential decrease in "Infiltration" and "Baseflow" compared to the forested section. There are no numerical data points or percentages provided.
Given the complexity of the image, the above description may not be entirely accurate.
Note: Both the topic and the answer were created by one of our users.

Two flow charts show water falling, flowing and flying back into the sky on a forest area on the left and a city area on the right. The difference between the two areas is shown in the details.

There is more evaporation in the forest and more transpiration. The rainfall is the same in the two charts, but there are no trees in the city and the water runs down the hill quickly, as the bigger arrows sugest that.

The same applies to infiltration; the signs under the forest show more water going deep down. In the city there is less. This is also shown in the water table which is much deeper under the urban.

Regarding erosion, the effects of the points above mean that more run off on the city side creates stronger flow in stream and rivers and the river at the bottom gets deeper too. The increased pollution is also mentioned, but not on the forest side.

Word Count: 161

Answers On The Same Topic:

The diagram below shows the water cycle in both forested and urban areas. Summarise the information by selecting and reporting the main features and make comparisons where relevant.

The process diagram illustrtates the water cycle in two different reigons namely, forested and urban enviroments.The water cycle consists of four stages which are precipitation,trtanspiration,infiltration and runoff. Overall,the water cycle consists of four stages which are precipitation,trtanspiration,infiltration and runoff. The cycle of rainfalls start with infiltrtation and end with the evaporation and this is the […]

The diagram below shows the water cycle in both forested and urban areas. Summarise the information by selecting and reporting the main features and make comparisons where relevant.

The diagram compares the water cycle in forested and urban environments, highlighting the differences in water movement. Overall, the water cycle is a continuous process that repeats over time. In both environments, the process starts with precipitation (rainfall) and ends with runoff. In the forested area, rainwater infiltrates the permeable topsoil and moves downward through […]

The diagram below shows the water cycle in both forested and urban areas. Summarise the information by selecting and reporting the main features and make comparisons where relevant.

The water cycle plays a key role in maintaing a healthy ecosystem. Life would be impossible without rain! The diagrams showcase how various environmental factors both positively and negatively impact the rain cycle. The picture on the left demonstrates the process of precipitation in a rainforest. The presence of trees and permeable topsoil encourages plenty […]

The diagram below shows the water cycle in both forested and urban areas. Summarise the information by selecting and reporting the main features and make comparisons where relevant.

The diagram compares the water cycle processes in forested and urban areas. It highlights key differences in infiltration, runoff, and evaporation between the two environments. In forested regions, precipitation is largely absorbed by the permeable topsoil, allowing significant infiltration into the ground. This contributes to the formation of a stable water table and baseflow. Evaporation […]

The diagram below shows the water cycle in both forested and urban areas. Summarise the information by selecting and reporting the main features and make comparisons where relevant.

The diagram in question provides a insight view on water cycle forested and urban sides. overall, the the water cycle of both areas are same. As the picyure shows the water cycle has the same path in both areas, and it commences with the precipitation. as water fall to the permeable topsoil , and the […]

See All

Other Topics:

The diagram shows the procedure for university entry for high school graduates. Summarize the information by selecting the main features and make comparisons

The given digram demostrates information about the whole process of how to enter the university for students who already passed high school and looking for a undergradute program. Overall, it is clearly seen that there are more than five steps to complete the registration process and it takes about a month to reach the university. […]

The given diagram indicates information about how used glass bottles are recycled. Summarize the information by selecting and reporting the main features, and make comparisons where relevant. Write at least 150 words

The diagram illustrates the information about steps to recycle a glass bottles. The first step is the costumer seperate a glass bottle from other trash and thrown them to collecting point. After that a trunk will collect bottles to the glass factory. Before a glass bottle transport to factory, they have to be clean by […]

The diagrams below show the water supply system in Australia at present and in future. Summarize the information by selecting and reporting the main features.

The diagrams illustrate how the water supply system in Australia operates at present and how it is expected to change in the future. Overall, the current system is relatively simple, with water flowing in one direction from storage to users and then being discarged into a river. By contrast, the future system introduces a recycling […]

the diagram below shows the production of olive oil. Write a report for a University lecturer describing this information

The process illustrates the production of olive oil. Overall the process insists of seven stages, starting with picking olives and finishing with storage and sale. To begin with, olives are picked to be passed through a special machine that rinses olives via mixing it with cold water. After that, olives are manufactured either to olive […]

The diagram shows how to make jam from the fruit. Summarise the information by selecting and reporting the main features, and make comparison where relevant.

The picture describes the process of making jam from the fruit. Overall, the process comprises a number of steps, beginning with washing fruits, followed by mashing, cooking and packing stages, and concluding with separating for each family. At the beginning of the process, 4kg of fruit are washed inside the sink with full water before […]

The diagram illustrates the process of how glass bottles are recycled. Summarise the information by selecting and reporting the main features, and make comparisons where relevant. Write at least 150 words.

The diagram illustrates the process of glass bottles are recycled. Used bottle from customers in collecting point are picked up by driver to stage 2. In this stage, the bottle went to cleaning plant with high pressure water to clean out the bottle. The bottle then classified by the color, green, brown, and clear glass. […]

See All
We have detected unusual activity on your device.
Please verify your identity to continue.
Note: This verification step won't sign you in. If you have a premium account, please log in to access the service as usual.
Google/Gmail Verification
Or verify using Email/Code
We've sent a verification code to:
youremail@gmail.com (Not your email?)
Enter it below to complete the verification process.
Ensure your email address is correct, your inbox is not full, and you check your spam folder. If no email arrives, consider using an alternative email.
You will need a Premium plan to perform your action!
Note: If you already have a premium account, please log in to access our services as usual.

Plans & Pricing

Our mission is to make quality education accessible for everyone.
However, to keep our hardworking team running and this service alive, we genuinely need your support!
By opting for a premium plan, not only do you sustain us in achieving the mission, but you also unlock advanced features to enrich your learning experience.

Free

For learners who aren't pressed for time

What's included on Free
100+ Cambridge IELTS Tests
Instant IELTS Writing Task 1 & 2 Evaluation (2 times/month)
Instant IELTS Speaking Part 1, 2, & 3 Evaluation (5 times/month)
Instant IELTS Writing Task 1 & 2 Essay Generator (2 times/month)
500+ Dictation & Shadowing Exercises
100+ Pronunciation Exercises
Flashcards
Other Advanced Tools

Premium

For those serious about advancing their English proficiency, and for IELTS candidates aspiring to boost their band score by 1-2 points (especially in writing & speaking) in just 30 days or less

What's included on Premium
Save Your IELTS Test Progress
Unlock All Courses & IELTS Tests
Unlimited AI Conversations
Unlimited AI Writing Enhancement Exercises
Unlimited IELTS Writing Task 1 & 2 Evaluation
Unlimited IELTS Speaking Part 1, 2, & 3 Evaluation
Checked Answers Will Not Be Published
Unlimited IELTS Writing Task 1 & 2 Essay Generator
Unlimited IELTS Speaking Part 1, 2, & 3 Sample Generator
Unlimited Usage Of Advanced Tools
Priority Support within 24h (12-month plan only)

Due to the nature of our service and the provided free trials, payments are non-refundable.
Nếu bạn là người Việt Nam và không có hoặc không muốn trả bằng credit/debit cards, bạn có thể thanh toán bằng phương thức chuyển khoản:


Chọn gói:
459,000₫ 347,000 ₫ cho gói 1 tháng (chỉ 11,567₫/ngày)
1,359,000₫ 797,000 ₫ cho gói 3 tháng (chỉ 8,856₫/ngày)
2,699,000₫ 1,367,000 ₫ cho gói 6 tháng (chỉ 7,594₫/ngày)
5,399,000₫ 1,997,000 ₫ cho gói 12 tháng (chỉ 5,547₫/ngày)


Sau khi chuyển khoản, vui lòng đợi trình duyệt tự động điều hướng bạn trở lại Engnovate và bạn sẽ ngay lập tức nhận được mã kích hoạt tài khoản premium.
Nếu có lỗi xảy ra, bạn có thể liên hệ với team thông qua một trong các phương thức: email đến helloengnovate@gmail.com hoặc nhắn tin qua facebook.com/engnovate.
Vì toàn bộ công cụ trên website đều có thể sử dụng thử miễn phí, Engnovate không hỗ trợ hoàn tiền.