Our system will evaluate the answer based on this AI-generated description.
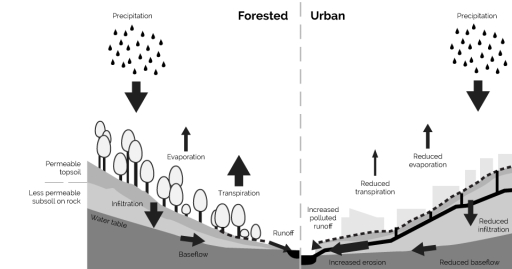
The image presents a comparative graphical depiction of water runoff in forested and urban settings. Both sections of the graph start with precipitation elements at the top. In the forested section, arrows point downward showing "Infiltration" through a "Permeable topsoil" and "Less permeable subsoil on rock" leading to "Water table" and then "Baseflow" with lateral arrows indicating "Evaporation" and "Transpiration" at the tree level, and "Runoff" at surface level. In contrast, the urban section arrows point towards "Reduced transpiration" and "Reduced evaporation" at the building level, with a significant arrow marked "Increased runoff" with side annotation "polluted" leading to "Increased erosion" with a consequential decrease in "Infiltration" and "Baseflow" compared to the forested section. There are no numerical data points or percentages provided.
Given the complexity of the image, the above description may not be entirely accurate.
Skyrocket your IELTS band score by 1-2 points in under a month with our premium plan!
Note: Both the topic and the answer were created by one of our users.
This diagram compares the process of rain formation in cities and in planted areas. The difference is due to the pavement of cities and the decrease in number of trees, which changes nature’s cycle.
Most obvious difference that could be seen is increase of runoff in the urban areas. This with the effects of reduced infiltration and baseflow increases the erosion in the citizes. More over the diagram demonstrates the decrease in evaporation and transpiration in the urban areas than the forested areas.
All of these differences would be due to the difference of type of land. The forested areas has permeable topsoil and subsoil on rock.
Word Count: 107
