Our system will evaluate the answer based on this AI-generated description.
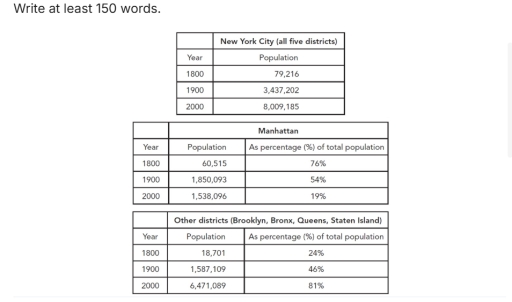
The image consists of three tables detailing population statistics for New York City and its districts across three selective years: 1800, 1900, and 2000. The first table displays New York City's total population, with figures: 79,216 in 1800, 3,437,202 in 1900, and 8,009,185 in 2000. The second table outlines Manhattan's population and its percentage relative to New York City's total population. Manhattan's population was 60,515 in 1800, accounting for 76% of New York City's population; in 1900 it recorded 1,850,093, comprising 54% of the total population; and in 2000 the population was 1,538,096, representing 19% of the total city population. The third table covers populations for other districts, namely Brooklyn, Bronx, Queens, and Staten Island, with respective populations: 18,701 in 1800 (24%), 1,587,109 in 1900 (46%), and 6,471,089 in 2000 (81%).
Given the complexity of the image, the above description may not be entirely accurate.
Skyrocket your IELTS band score by 1-2 points in under a month with our premium plan!
Note: Both the topic and the answer were created by one of our users.
The first given table represents changes in the total population of New York City between 1800 to 2000. The other tables illustrate changes in the populations of the five districts of the city ( Manhattan, Brooklyn, Bronx, Queens, Staten Island) over the period.
Overall, the 3 tables show population of New York City, population of Manhattan district and population of other districts ( Brooklyn, Bronx, Queens, Staten Island ). All five districts population is in the New York City. These tables depend on the time period ( 1800-2000 ).
In New York City, high population represents from 2000 which is 8,009,185 and lowest number of population represents from 1800 which is 79,216. The population rapidly increased between 1800 to 2000. In 1900, it shows 3,437,202 population.
In Manhattan district, lowest population represents from 1800 which is 60,515 (76%). Consequently, the population is increased from 2000 which is 1,538,096 (19%). Between 1800 and 1900 shows rapid increasment and between 1900 and 2000 shows gradual increasment.
In other district, high population represents from 2000 which is 6,471,089 (81%). lowest population represents from 1800 which is 18,701 (24%).
Word Count: 185