🔥 Today Only: Save 30% on Premium — Offer Ends Soon! - Upgrade Now!
Process Diagram

Band 5+: The flow chart illustrates the consequence of deforestation. Summarise the information by selecting and reporting the main features.

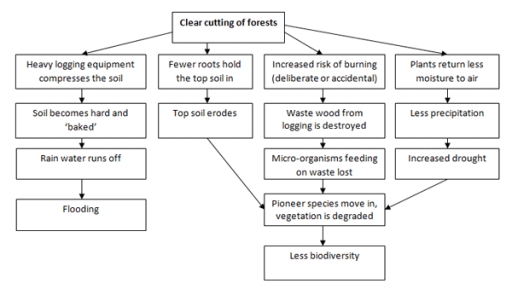
Image for topic: The flow chart illustrates the consequence of deforestation. Summarise the information by selecting and reporting the main features.
Our system will evaluate the answer based on this AI-generated description.
The image displays a flowchart diagram explaining the negative effects of clear-cutting forests, starting point Clear-cutting of forests lead to three initial consequences: Heavy logging equipment compresses the soil, Fewer roots hold the topsoil in, Increased risk of burning (deliberate or accidental). The first leads to Soil becomes hard and 'baked', resulting in Rainwater runs off which causes Flooding. The second leads to Topsoil erodes. The third leads to Waste wood from logging is destroyed, and Plants return less moisture to air. Destruction of waste wood means Micro-organisms feeding on waste lost which results in Pioneer species move in, vegetation is degraded leading to Less biodiversity. Plants returning less moisture results in Less precipitation which leads to Increased drought. No numerical data points/percentages provided.
Given the complexity of the image, the above description may not be entirely accurate.
Note: Both the topic and the answer were created by one of our users.

The provided flow chart presents the possible results of cutting down of forests.

Overall,deforestation can result with several consequences such as flooding,soil erodation and increased drought which they also lead less biodiversity.

In flow chart,the major possible consequence of clear cutting of forest is damage by heavy logging equipment which lead becoming soil hard and baked.Hence,the water runs off and it results with flooding. The other created potential outcome is increased risk of burning which that might be happen both deliberately or accidentally.It results with wasting woods from logging and losts feeds for micro-organisms.Additionally,pioneer species move in and the vegetation is degrading from time to time.Meanwhile,at the end of chain reduction experienced on biodiversity.

Cutting down of forests led to both fewer roots which serve hold the top soil in place and become plants less moisture.However,it means less precipitation and increased drought.Consequently,all these problems cause less biodiversity which is the biggest danger for environment.

Word Count: 154

Answers On The Same Topic:

The flow chart illustrates the consequence of deforestation. Summarise the information by selecting and reporting the main features.

The flowchart delineates the adverse consequences resulting from deforestation, illustrating a sequential process that impacts ecological balance and environmental integrity. In summary, deforestation engenders soil compression, erosion, elevation of fire risks, and exacerbation of drought conditions. These interconnected consequences collectively undermine local biodiversity and promote the establishment of pioneer species, thereby diminishing the ecological health […]

The flow chart illustrates the consequence of deforestation. Summarise the information by selecting and reporting the main features.

The flow chart illustrates the cosequence of deforestation and predictions for the Earth. Overall, all cutting of forests could cause less biodiversity and flooding. Firstly, deforestation lead to fewer roots hold the top soil in, after that top soil errodes or other collum with plants return less moisture to air next to less precipitation meanwhile […]

The flow chart illustrates the consequence of deforestation. Summarise the information by selecting and reporting the main features.

deforestation is mainly cause an environmental pendamic.starting from the cutting of trees with a heavy logging equipment which compress the level of soil due to which soil becomes hard indicating the loss of rain water to soil and cause flood. fewer roots hold the trop soil in and top of the soil start erodes which […]

The flow chart illustrates the consequence of deforestation. Summarise the information by selecting and reporting the main features.

The flow chart gives information about the consequence of deforestation .When trees are removed, there are four main effects which results in flooding, vegetation is degraded and a loss of biodiversity. Firstly, one of the effects started with compressing soil with equipment which leads to have hard and bakes soil. Moreover, the rain water run-off […]

The flow chart illustrates the consequence of deforestation. Summarise the information by selecting and reporting the main features.

The flowchart shows the different effects that happen when forests are clear-cut. There are four main ways that cutting down trees impacts the environment, eventually leading to a drop in biodiversity. First, the use of heavy logging equipment makes the soil very hard and “baked.” Because the ground is so compressed, rainwater cannot soak into […]

See All

Other Topics:

the diagram below shows the development of a small fishing village and its sorruonding area into a large tourist resort

The maps illustrates the transformation of a miniature fishing village and its surroundings into a large European resort for tourist. Overall, it is evident that total layout underwent significant redevelopment, becoming more commercialised . At first, there were a huge improvements in transport fasilities. By the final year, surroung area of village became more populated […]

The following maps show recent archaeological findings at historic site in the year 2004 and 2014.

The given maps illustrate the changes in some archaeological findings and some natural places at a historic site between 2004 and 2014. Overall, there is no change in the ancient temple over the decades, while some new constructions were added to expand this area. In 2004, there were some trees at the left of the […]

The diagram illustrates a life cycle of sea turtle.Summarise the important information by selecting and reporting the main features, and make comparisons where relevant.

The diagram illustrates the life cycle of a sea turtle. It shows the different stages a sea turtle goes thoughout its life. First, the eggs are laid and they are in a nest for 6-8 weeks as a result of nesting and after this time period completes, they hatch. After 3 years from hatching, they […]

The diagram below illustrate how recycled paper is made. Summarize the information by describing the main features of the charts and making comparisons where appropriate

The diagram illustrates the step-by-step process of how paper is recycled. Overall, the process consists of 4 distinct steps which could be divided into 2 stages, collecting and processing the papers. It is also clear that this is a relatively complex process that requires heavy machinery. To begin with, the used paper is collected, before […]

The diagram shows production of sugar by a German company for supermarkets and restaurants

The illustration describes the multi-stage process of production of sugar by a German organization for supermarkets and restaurants. Overall, the process involves several physical and transportation stages, transforming sugarcane into sugar product. The process begins with the harvesting of sugarcane and ends with delivery to supermarkets and restaurants. At the beginning of the process, sugarcane […]

The diagram below shows the production of smoked fish. Summarise the information by selecting and reporting the main features, and make comparisons where relevant.

The picture shows how smoked fish is produced in several stages. Overall, there are seven stages of producing the smoked fish starting from gutting and ending with transportation. It is clear that salt-water and smoking procedures take the longest time, while for the time spent on the remaining stages is significantly less. In the first […]

See All
We have detected unusual activity on your device.
Please verify your identity to continue.
Note: This verification step won't sign you in. If you have a premium account, please log in to access the service as usual.
Google/Gmail Verification
Or verify using Email/Code
We've sent a verification code to:
youremail@gmail.com (Not your email?)
Enter it below to complete the verification process.
Ensure your email address is correct, your inbox is not full, and you check your spam folder. If no email arrives, consider using an alternative email.
You will need a Premium plan to perform your action!
Note: If you already have a premium account, please log in to access our services as usual.

Plans & Pricing

Our mission is to make quality education accessible for everyone.
However, to keep our hardworking team running and this service alive, we genuinely need your support!
By opting for a premium plan, not only do you sustain us in achieving the mission, but you also unlock advanced features to enrich your learning experience.

Free

For learners who aren't pressed for time

What's included on Free
100+ Cambridge IELTS Tests
Instant IELTS Writing Task 1 & 2 Evaluation (2 times/month)
Instant IELTS Speaking Part 1, 2, & 3 Evaluation (2 times/month)
Instant IELTS Writing Task 1 & 2 Essay Generator (2 times/month)
500+ Dictation & Shadowing Exercises
100+ Pronunciation Exercises
Flashcards
Other Advanced Tools

Premium

For those serious about advancing their English proficiency, and for IELTS candidates aspiring to boost their band score by 1-2 points (especially in writing & speaking) in just 30 days or less

What's included on Premium
Save Your IELTS Test Progress & Analyze Mistakes By Question Type
Save Your Own Flashcard Sets & Use Them On Any Device
Unlock All Courses, IELTS Tests, Section & Part Practice
Unlimited AI Conversations
Unlimited AI Writing Enhancement Exercises
Unlimited IELTS Writing Task 1 & 2 Evaluation
Unlimited IELTS Speaking Part 1, 2, & 3 Evaluation
Checked Answers Will Not Be Published
Unlimited IELTS Writing Task 1 & 2 Essay Generator
Unlimited IELTS Speaking Part 1, 2, & 3 Sample Generator
Unlimited Usage Of Advanced Tools & AI Features
Priority Support within 24h (12-month plan only)

Due to the nature of our service and the provided free trials, payments are non-refundable.
Nếu bạn là người Việt Nam và không có hoặc không muốn trả bằng credit/debit cards, bạn có thể thanh toán bằng phương thức chuyển khoản:


Chọn gói:
419,000₫ 277,000 ₫ cho gói 1 tháng (chỉ 9,233₫/ngày)
1,239,000₫ 597,000 ₫ cho gói 3 tháng (chỉ 6,633₫/ngày)
2,469,000₫ 1,027,000 ₫ cho gói 6 tháng (chỉ 5,706₫/ngày)
4,929,000₫ 1,417,000 ₫ cho gói 12 tháng (chỉ 3,936₫/ngày)


Sau khi chuyển khoản, vui lòng đợi trình duyệt tự động điều hướng bạn trở lại Engnovate và bạn sẽ ngay lập tức nhận được mã kích hoạt tài khoản premium.
Nếu có lỗi xảy ra, bạn có thể liên hệ với team thông qua một trong các phương thức: email đến helloengnovate@gmail.com hoặc nhắn tin qua facebook.com/engnovate.
Vì toàn bộ công cụ trên website đều có thể sử dụng thử miễn phí, Engnovate không hỗ trợ hoàn tiền.