Our system will evaluate the answer based on this AI-generated description.
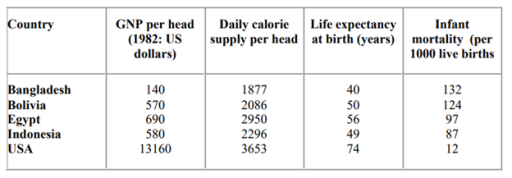
The image depicts a table comparing five countries - Bangladesh, Bolivia, Egypt, Indonesia, and the USA - across four categories: GNP per head in the 1982 US dollars, daily calorie supply per head, life expectancy at birth (years), and infant mortality per 1000 live births. Bangladesh's GNP per head is the lowest at 140, with a daily calorie supply of 1877, a life expectancy of 40 years, and the highest infant mortality rate of 132. Bolivia has a GNP per head of 570, a daily calorie supply of 2086, a life expectancy of 50, and an infant mortality rate of 124. Egypt's GNP per head is 690, with a daily calorie supply of 2950, a life expectancy of 56, and an infant mortality rate of 97. Indonesia has a GNP per head of 580, a daily calorie supply of 2296, a life expectancy of 49, and an infant mortality rate of 87. USA has the highest GNP per head at 13,160, the highest daily calorie supply at 3653, a life expectancy of 74, and the lowest infant mortality rate at 12.
Given the complexity of the image, the above description may not be entirely accurate.
Skyrocket your IELTS band score by 1-2 points in under a month with our premium plan!
Note: Both the topic and the answer were created by one of our users.
The table presents four economic indicators that illustrate the standard of living in five selected countries in 1982. Overall, it is evident that the quality of life in the USA was significantly higher than in the other four countries, with Bangladesh having the lowest quality of life.
To start, the USA, classified as a developed country, had the highest GNP at $13,160 per capita. It also boasted a much higher daily calorie intake, greater life expectancy, and the lowest infant mortality rate among the nations studied. In contrast, Bangladesh’s GNP was nearly one hundred times smaller than that of the USA, with its calorie intake and life expectancy being approximately half of those in the USA, and its infant mortality rate being ten times greater.
The other developing countries displayed significantly lower quality of life ratings. The indicators for Egypt, Indonesia, and Bolivia were quite similar, with Egypt showing the highest quality of life among the three. However, Egypt’s infant mortality rate was slightly higher than that of Indonesia, registering at 97 deaths per 1,000 live births compared to 78 in Indonesia.
Word Count: 182
