Our system will evaluate the answer based on this AI-generated description.
The image depicts average house prices in three countries from 1997 to 2014, revealing the following data points across the timeline: 1997 shows Country A at 200, Country B at 400, Country C between 500-550; 1998, Country A at 230, Country B at 450, Country C at about 500; 1999, Country A at 275, Country B at 475, Country C about 450; 2000, Country A at 280, Country B at 480, Country C around 480; 2001, Country A at 300, Country B at 490, Country C around 450; 2002, Country A at 325, Country B at 500, Country C about 450; 2003, Country A almost 400, Country B near 530, Country C about 500; 2004 shows Country A peaking above 500, Country B at 550, Country C above 500; 2005, Country A nearly reaches 750, Country B at 580, Country C above 500; 2006, Country A slightly above 750, Country B over 600, Country C above 500; 2007, Country A reaches 800, Country B about 650, Country C above 500; 2008 sees Country A at 750, Country B at 675, Country C above 500; 2009 presents Country A at 700, Country B nearing 620, Country C above 500; 2010 shows Country A at 750, Country B at 600, Country C about 450; 2011, Country A around 800, Country B near 600, Country C nearly 400; 2012 shows Country A around 850, Country B at 600, Country C about 450; 2013, Country A at 850, Country B near 600, Country C around 450; 2014 shows Country A nearing 900, Country B steady at 600, Country C about 500, maintaining consistent house prices throughout respective years.
Given the complexity of the image, the above description may not be entirely accurate.
Skyrocket your IELTS band score by 1-2 points in under a month with our premium plan!
Note: Both the topic and the answer were created by one of our users.
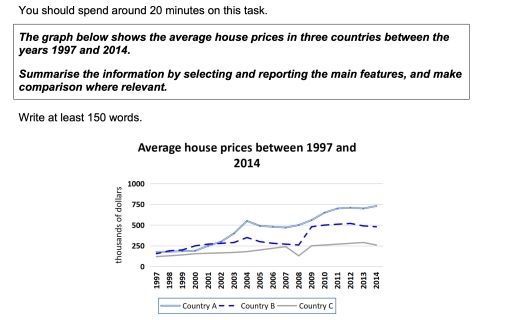
The line graph illustrates the cost of house prices over a seventeen-year period from 1997 to 2014. Overall, all countries experienced a slight increase over the given period. Despite some fluctuations, Country A recorded the highest house prices, followed by Country B, while Country C recorded the lowest.
Country A and Country B had a similar level of house prices in the initial years, both standing at around $200,000. The situation started to change at the beginning of the century, when prices began to rise. Between 2000 and 2004 the former rose to almost $550,000 from $300,000, whereas the latter increased to $300,000 from $250,000. Despite some fluctuations, Country A grew to $750,000. While Country B dropped to $250,000, in the next year the figure increased to $500,000. Between 2009 and 2014 it remained unchanged.
Country C, however, somewhat bucked the trend. It started at $100,000, while it increased consistently until 2007, when it reached $250,000. Then in 2008 it dropped to $80,000, whereas it increased again to $250,000. Between 2009 and 2013 Country C experienced a slight increase to $270,000, with a decline to $250,000 in the final year.
Word Count: 190
