Our system will evaluate the answer based on this AI-generated description.
The image depicts average house prices in three countries from 1997 to 2014, revealing the following data points across the timeline: 1997 shows Country A at 200, Country B at 400, Country C between 500-550; 1998, Country A at 230, Country B at 450, Country C at about 500; 1999, Country A at 275, Country B at 475, Country C about 450; 2000, Country A at 280, Country B at 480, Country C around 480; 2001, Country A at 300, Country B at 490, Country C around 450; 2002, Country A at 325, Country B at 500, Country C about 450; 2003, Country A almost 400, Country B near 530, Country C about 500; 2004 shows Country A peaking above 500, Country B at 550, Country C above 500; 2005, Country A nearly reaches 750, Country B at 580, Country C above 500; 2006, Country A slightly above 750, Country B over 600, Country C above 500; 2007, Country A reaches 800, Country B about 650, Country C above 500; 2008 sees Country A at 750, Country B at 675, Country C above 500; 2009 presents Country A at 700, Country B nearing 620, Country C above 500; 2010 shows Country A at 750, Country B at 600, Country C about 450; 2011, Country A around 800, Country B near 600, Country C nearly 400; 2012 shows Country A around 850, Country B at 600, Country C about 450; 2013, Country A at 850, Country B near 600, Country C around 450; 2014 shows Country A nearing 900, Country B steady at 600, Country C about 500, maintaining consistent house prices throughout respective years.
Given the complexity of the image, the above description may not be entirely accurate.
Skyrocket your IELTS band score by 1-2 points in under a month with our premium plan!
Note: Both the topic and the answer were created by one of our users.
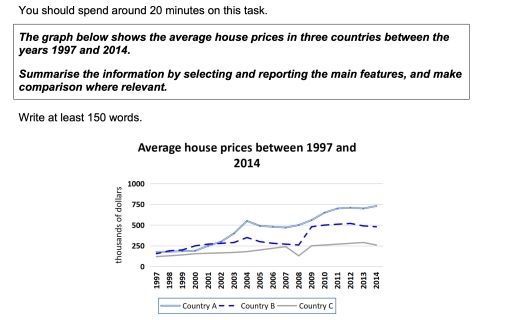
The line graph compares the average price of houses in three countries from 1997 to 2014. Overall, all countries experienced an upward trend, though Country A saw the most significant rise, while Country C remained considerably lower throughout the period.
In the initial year, house prices were similar in Countries A and B, at just below $200,000, whereas Country C recorded a lower figure of around $120,000. Prices in A and B increased gradually until the early 2000s, after which Country A rose sharply, reaching approximately $550,000 by 2004. By contrast, Country B grew more slowly, climbing to only $300,000.
The difference between the two narrowed by 2009, when prices in B reached about $500,000 and those in A fell slightly to just over $530,000. However, from that point onward, Country A’s prices began to rise again, peaking at around $750,000 in 2014, whereas Country B remained relatively stable at slightly below $500,000.
Country C consistently showed the lowest values. Although prices increased steadily to around $240,000 in 2007, they dropped sharply the following year before recovering to $250,000 in 2009. The figure then fluctuated modestly and ended at roughly the same level in 2014.
Word Count: 195