Our system will evaluate the answer based on this AI-generated description.
The image depicts average house prices in three countries from 1997 to 2014, revealing the following data points across the timeline: 1997 shows Country A at 200, Country B at 400, Country C between 500-550; 1998, Country A at 230, Country B at 450, Country C at about 500; 1999, Country A at 275, Country B at 475, Country C about 450; 2000, Country A at 280, Country B at 480, Country C around 480; 2001, Country A at 300, Country B at 490, Country C around 450; 2002, Country A at 325, Country B at 500, Country C about 450; 2003, Country A almost 400, Country B near 530, Country C about 500; 2004 shows Country A peaking above 500, Country B at 550, Country C above 500; 2005, Country A nearly reaches 750, Country B at 580, Country C above 500; 2006, Country A slightly above 750, Country B over 600, Country C above 500; 2007, Country A reaches 800, Country B about 650, Country C above 500; 2008 sees Country A at 750, Country B at 675, Country C above 500; 2009 presents Country A at 700, Country B nearing 620, Country C above 500; 2010 shows Country A at 750, Country B at 600, Country C about 450; 2011, Country A around 800, Country B near 600, Country C nearly 400; 2012 shows Country A around 850, Country B at 600, Country C about 450; 2013, Country A at 850, Country B near 600, Country C around 450; 2014 shows Country A nearing 900, Country B steady at 600, Country C about 500, maintaining consistent house prices throughout respective years.
Given the complexity of the image, the above description may not be entirely accurate.
Skyrocket your IELTS band score by 1-2 points in under a month with our premium plan!
Note: Both the topic and the answer were created by one of our users.
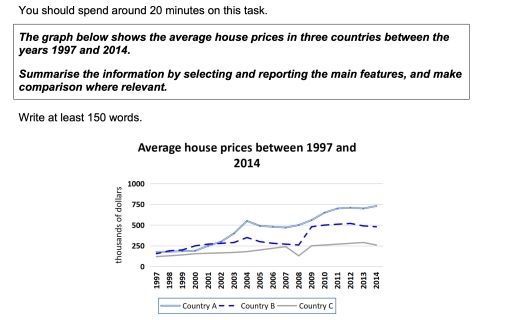
The line graph illustrates the changes in accommodation costs in three countries from 1997 to 2014.
Overall, the house prices in the given countries adhered to rising trends, albeit to varying degrees. While Country A generally had higher housing costs, followed by Country B, Country C remained at the bottom, despite a gradual increase.
Country A and Country B shared similar standings in the initial years, having a price tag of almost $200,000. It was not until these costs began to surge at the turn of the century, with the former country raising the prices to $550,000 in 2004 and the latter reaching $300,000. This gap had narrowed down by 2009, when Country B priced a single house at a whopping $500,000 and Country A experienced a marginal decline to $530,000 in its house values. From that year on, the discrepancy became more pronounced, with Country A seeing its accommodation prices skyrocket to $750,000 and Country B remaining stable in its figures.
Country C, however, somewhat bucked the trend. Starting at about $120,000, the housing cost in this country followed an uninterrupted upward trajectory before doubling in 2007, after which it bounced back to its starting point a year later. In 2009, this figure rebounded to $250,000 and maintained a steady growth to $270,000 in 2013, thereafter which it fell back to the previous peak – $250,000.
Word Count: 227