Our system will evaluate the answer based on this AI-generated description.
The image visualizes banana prices from 1994 to 2004 across Japan, France, Germany, and the USA in US dollars per kilogram. In 1994, Japan priced at 2.50, France at 2.00, Germany at 1.50, and USA at 1.00. For 1995, Japan hit 3.00, France 2.00, Germany 1.50, USA 1.00, decreasing sharply for Japan in 1996 to 1.50, remaining unchanged for France, Germany, USA. In 1997, Japan rose to 2.00, France and USA stable, Germany increased slightly above its past values, again adjusting by 1998 alongside moderate fluctuations across all countries. 1999 showed consistency for USA at 1.00, with Japan slightly below 1.50, France moving slightly upwards, Germany returning nearly to its 1996 price pattern. 2000 contrasted slightly with Japan's reset to 1.50, France still close to 2.00, Germany at 1.50, USA unchanged, France escalated marginally in 2001, each showing slight stability except Japan which fell beneath its former mark. 2002 noted increase for Germany above 1.50, Japan nearing close to former highs, USA steady, France subtly escalating. In 2003, Japan and France exceeded previous values reaching proximity with each other, Germany floating near its standard price range, USA adhering to its previous years. Finally, in 2004, Japan witnessed an apex just beyond 2.50, others showed marginal deviations towards their preceding years' numbers maintaining the noted variance trend within the decade.
Given the complexity of the image, the above description may not be entirely accurate.
Skyrocket your IELTS band score by 1-2 points in under a month with our premium plan!
Note: Both the topic and the answer were created by one of our users.
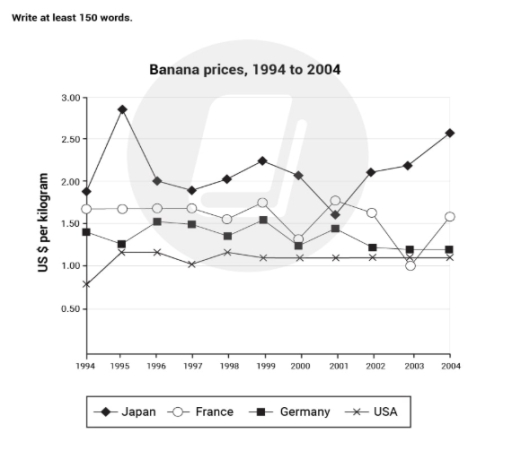
The linen graph illustrates data about the cost of bananas in four different countries from 1994 to 2004.
Overall, there is an information about the price per kilogram, given in the US $. In contrast to other countries which either remained the same, rose or fell slightly, over the first 3 years, banana’s prices in Japan had reached its peak almost in the beggining, but fell immidiately. Another noticeable trend is that from 1997 Japan, Germany and France strated flucturating, while the USA remained the same.
To continue about Japan, in 1995 price there rose from 1.90$ to 2.80$ that is the highest outcome of this graph. However, in 2001 it decreased to its lowest point that is 1.60$ per kilogram. Afterwards, there is seen that first, it increased back, and second it ends up with 2.50$ per kilogram.
Next, France and Germany, from 1996 they both had a gradual decrease and met on 1.25$ in 2000. Over the next 4 years they continued flucturating and almost crossed the USA, which kept its price on 1.10$ per kilogram from 1998 to 2004.
Word Count: 182