Our system will evaluate the answer based on this AI-generated description.
The image contains a line graph detailing U.S. government spending on research from 1980 to 2008 across five categories: Health, Space, Energy, General Science, and Other. The y-axis represents expenditure in US dollars (billions), ranging from 0 to 25, and the x-axis symbolizes years, progressing from 1980 to 2008 in 4-year intervals. Health spending shows a stable increase from approximately 5 billion in 1980 to just under 10 billion in 1992, then a sharp rise to nearly 25 billion in 2004, before slightly declining in 2008. Space expenditure remains constant around 15 billion from 1980 until a peak at just over 15 billion in 1996, followed by a decline to approximately 5 billion in 2008. Energy spending starts close to 10 billion in 1980, declining to just under 5 billion in 1984, then fluctuates between 3 to 5 billion until 2008. General Science expenditure begins around 2 billion in 1980, gradually increasing to approximately 7 billion in 2008. The Other category shows a steady incline from around 2 billion in 1980 to 7 billion in 2008, with slight fluctuations.
Given the complexity of the image, the above description may not be entirely accurate.
Skyrocket your IELTS band score by 1-2 points in under a month with our premium plan!
Note: Both the topic and the answer were created by one of our users.
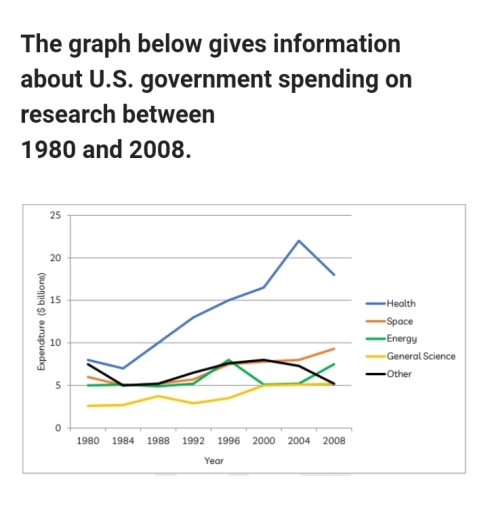
The line graph portrays the U.S. government’s research expenditure from 1980 to 2008, categorized into Health, Space, Energy, General Science, and Other.
The chart delineates fluctuations in research funding across the specified categories, with Health receiving the highest investment and General Science the least. Energy spending showed significant variability over the period.
Commencing in 1980, Health research funding surged from around $8 billion to a brief decline by 1984, only to soar to nearly $22 billion in 2004. Despite a dip to approximately $18 billion in 2008, Health research maintained the highest funding levels. In stark contrast, General Science research saw minimal funding, starting at nearly $3 billion in 1980 and gradually climbing to $5 billion by 2008.
In 1980, Energy and Space research received $5 billion and $6 billion respectively, with Space briefly peaking at over $15 billion in 1996 before declining to around $5 billion in 2008. Energy research fluctuated between $3 to $5 billion throughout the period. Conversely, ‘Other’ research expenses rose steadily from $2 billion in 1980 to $7 billion in 2008, experiencing slight fluctuations along the way
Word Count: 182