Our system will evaluate the answer based on this AI-generated description.
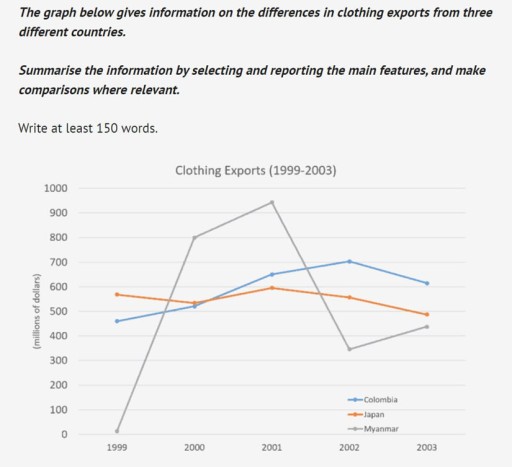
The image shows a line graph representing the clothing exports of Colombia, Japan, and Myanmar between 1999-2003. In 1999, Colombia had just under 200 million GBP, Japan had around 400 million GBP, and Myanmar had about 100 million GBP in exports. By 2000, Colombia's exports slightly increased to over 200 million GBP, Japan saw a small decrease to just under 400 million GBP, while Myanmar had significant growth to over 500 million GBP. In 2001, Colombia remained constant, Japan decreased further to around 300 million GBP, and Myanmar reached its peak at over 900 million GBP. However, in 2002, Colombia's exports declined to around 150 million GBP, Japan remained steady, and Myanmar faced a sharp decrease to under 700 million GBP. In 2003, all three countries saw a decline in clothing exports, with Colombia at around 50 million GBP, Japan just over 200 million GBP, and Myanmar just under 600 million GBP.
Given the complexity of the image, the above description may not be entirely accurate.
Skyrocket your IELTS band score by 1-2 points in under a month with our premium plan!
Note: Both the topic and the answer were created by one of our users.
The line graph illustrates garments overseas sales namely Colombia, Japan and Myanmar over 23 years period from 1990 and 2013.
From an overall perspective, what stands out in the graph, Myanmar was not popular among two lines, and reached 430 million dollars, but over 23 years period Colombia yielded positive results and attained approximately 600 million dollars.
Looking at the details, Myanmar began 0 million but this time figure rose sharply also in 2000 year line hit 800 million, this year trend also rose sharply achieved circa 940 million. If we looking at, by the end of the year, line reached 430 million dollars. Focusing on the, second trend, specifically Japan, this curve started roughly 580 million dollars but in 2000 trend decreased 520, also, in 2011 data line increased 600 million, and this year data line plummeted.Towards the end of the year figure peaked 590 million dollars.
Shifting focus to the last curve, to be precise Colombia, this line began approximately 570 million. If we looking at details, this trend increased steadily until 2012 and attained 700 million but this year, figure dropped also achieved roughly 600 million dollars.
Word Count: 190
