Our system will evaluate the answer based on this AI-generated description.
The image depicts average carbon dioxide emissions per person in metric tonnes in the United Kingdom, Sweden, Italy, and Portugal from 1967 to 2007. In 1967, emissions were highest in the United Kingdom at approximately 11 metric tonnes, followed by Sweden at around 9 metric tonnes, Italy at roughly 4 metric tonnes, and Portugal at about 1 metric tonne. By 1977, United Kingdom emissions decreased to around 10 metric tonnes, while Sweden’s emissions peaked at nearly 11 metric tonnes. Italy’s emissions rose to about 6 metric tonnes, and Portugal’s increased to around 2 metric tonnes. In 1987, the United Kingdom’s emissions were around 9.5 metric tonnes, Sweden’s dropped to approximately 7.5 metric tonnes, Italy’s continued to rise to about 7 metric tonnes, and Portugal’s grew to around 3.5 metric tonnes. By 1997, the United Kingdom’s emissions decreased further to around 9 metric tonnes, Sweden’s reduced significantly to about 5.5 metric tonnes, Italy’s plateaued at 8 metric tonnes, and Portugal’s increased to around 4.5 metric tonnes. In 2007, the United Kingdom’s emissions were approximately 8.5 metric tonnes, Sweden’s fell to around 6 metric tonnes, Italy’s emissions slightly decreased to about 7.75 metric tonnes, and Portugal’s emissions reached roughly 5 metric tonnes.
Given the complexity of the image, the above description may not be entirely accurate.
Skyrocket your IELTS band score by 1-2 points in under a month with our premium plan!
Note: Both the topic and the answer were created by one of our users.
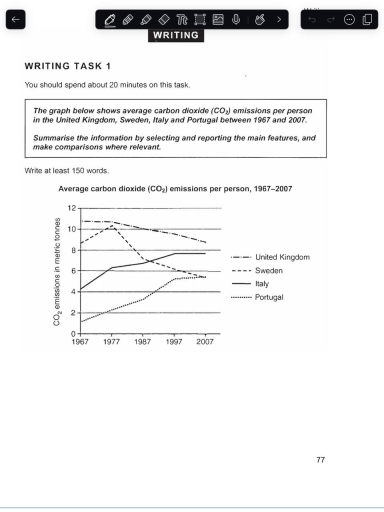
The line graph illustrates estimate carbon dioxide pollutants per individual in the United Kingdom, Sweden, Italy, in addition Portugal among 1967 to 2007.
In an overview, average carbon dioxide emission of individuals in United Kingdom and Sweden gradually diminished , whereas carbon dioxide emission per person in Italy and Portugal dramatically spiked.
In 1967 United Kingdom above 10 metric tones of average carbon dioxide emission per the persons while, Sweden is above 8 metric tones of the average carbon dioxide emission of the individuals. Later on, in 2007 both country rate is significantly turn downed.
In contrast, in 1967 Italy started the average carbon dioxide emission is above 4 metric tone at that year Portugal started below 2 metric tones after that, in 2007 the average carbon dioxide emission rate arrived 8 metric tone on Italy. While, the same year the average emission value is enhanced around 5 metric tones. At the end, Sweden and Portugal reached the same level in 2007.
Word Count: 162