🔥 Today Only: Save 30% on Premium — Offer Ends Soon! - Upgrade Now!
Bar Chart

Band 5+: The graph below shows average time spent on social media from 2016 to 2020

Image for topic: The graph below shows average time spent on social media from 2016 to 2020
Our system will evaluate the answer based on this AI-generated description.
The image depicts a vertical bar graph titled "The Average Time Spent on Social Media from 2000 to 2020," with the x-axis representing years from 2016 to 2020 and the y-axis representing average time spent in minutes, ranging from 0 to 60 in increments of 10. Four social media platforms are shown: Facebook, Twitter, Instagram, and Snapchat. For 2016, Facebook usage is around 35, Twitter 30, Instagram 20, and Snapchat 10 minutes. In 2017, Facebook increases slightly above 35, Twitter dips below 30, Instagram jumps to just over 30, and Snapchat rises to around 15 minutes. The year 2018 shows Facebook at approximately 40, Twitter back to 30, Instagram close to around 45, and Snapchat at 20 minutes. The 2019 data shows a significant increase, with Facebook around 45, Twitter just above 30, Instagram at 50, and Snapchat nearing 30 minutes. Finally, in 2020, Facebook minutes are over 50, Twitter remains consistent at just above 30, Instagram reaches slightly below 60, and Snapchat rises above 30 minutes.
Given the complexity of the image, the above description may not be entirely accurate.
Note: Both the topic and the answer were created by one of our users.

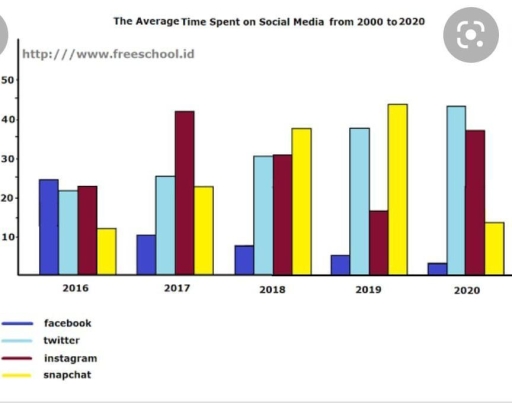
The proportion of average duration on various social platforms (Facebook, Twitter, Instagram, and Snapchat) over a period of two decades is examined in the illustrated bar graph. Units are measured in minutes.

Overall, it is clear that Snapchat’s figure was the highest within the period. In contrast, the pattern of Facebook was the lowest. Instagram and Twitter figures were showed fluctuations.

At the beginning of the duration, the ratio of Facebook stood at 25 minutes, in 2016, and there was a dramatic decrease to almost 2 minutes, in 2020. In complete contrast to this, the amount of Twitter started at about 22 minutes, in 2016, then it witnessed a slight increase and reached approximately 45 minutes in 2020.

On the other hand, the spending time on Instagram and Snapchat was roughly 25 minutes and 10 minutes, respectively, in 2016. Snapchat quantity increased slightly, reaching a high peak at 45 minutes in 2019 before a decrease till 2020.

Word Count: 157

Answers On The Same Topic:

The graph below shows average time spent on social media from 2016 to 2020

The bar chart illustrates the average time spent on social media from 2000 to 2020. Overall, the data shows significant fluctuations throughout this period. In 2016, Facebook, Twitter, and Instagram were closely aligned, with average usage between 20 and 25 minutes per day. In contrast, Snapchat recorded the lowest average usage at just below 10 […]

The graph below shows average time spent on social media from 2016 to 2020

The bar chart shows the average time spent on social media between 2000 and 2020. Overall, the bar charts were unstable all over the peiod. In 2016 facebook, twitter and instagram were almost in the same place between 20 and 25, when the snapchat was lowest from these bar charts just below 10. In 2017 […]

The graph below shows average time spent on social media from 2016 to 2020

The bar chart illustrates information about the average length of time users spent on social media between 2016 and 2020. Overall, the data of time that users spent on Twitter witnessed an upward trend while Facebook showed a downward trend, the figure for people opting for using Instagram and Snapchat either dropped or increased. Obviously, […]

The graph below shows average time spent on social media from 2016 to 2020

The given bar chart provides information on how much time was spent by people using various social networking sites over a four-year period between 2016 and 2020. Overall what stand out from the graph is that Facebook, which was the most popular platform in 2016, gradually lost its popularity making way for Twitter and Instagram, […]

See All

Other Topics:

The bar chart shows the number of visits to a community website in the first and second years of use. Summarise the information by selecting and reporting the main features, and make comparisons where relevant.

The bar chart illustrates the number of visits to a community website during the first and second years. From an overall perspective, the second year of use experienced a significant increase in the middle and later months, while website recorded fewer visits in total in the first year. In addition, the number of visits in […]

The graph below shows information about the activities that New Zealand children enjoy doing the most in 2007.

The bar chart provides information about the different pastime activities that boys and girls preferred. From an overall perspective, the highest percentages of boys enjoyed sports and going to the park, while girls showed a greater preference for art and craft. In addition, the rate of both genders watching DVDs were identical. Taking a closer […]

The graph below shows the annual book sales in three book stores between 2001 and 2005. Summarize the information by selecting and reporting the main features, and make comparisons where relevant.

The presented bar chart compare the number of salling books for three shops from 2001 to 2005. Overall, Limromania was the most popular book store of all time. In contrast, Reader’s Corner had the lowest sales, while Book Buffs showed a good indicator, trying to catch up the first one. In 2001, both Libromania and […]

The bar graph shows the global sales (in billion of dollars) of different types of digital games between 2000 and 2006.

The bar graph illustrates the worldwide purchases of various kinds of electranic games from the year 2000 to 2006 in billion of dollars. Overall, there is an increase in the sales throughout the period accept for the console games that have experienced a slight decline. Household games remained the most popular type of game during […]

The bar graph below shows the imports of electronics goods in 2000 and 2006, write it down.

The graph illustrates the importation of DVD players, CD players, televisions, radios and video recorders, in millions of units, in two different years -2000 and 2006. Overall, DVD players, televisions and radios increased their imports over the time, whereas CD players and video recorders imports decreased showing an opposite trend. Television was the most imported […]

The bar chart shows the scores of teams A, B and C over four different seasons. Summarise the information by selecting and reporting the main features and make comparisons where relevant.

The graph is illustrating how many points recieved 3 teams in 4 seasons: 2002, 2003, 2004, 2005. Overall, we see dominating from team B in all years of championship, but in 2004 team A was very close to steal a win. From graph we can see the tendence of Team B’s domination, while their opponents […]

See All
We have detected unusual activity on your device.
Please verify your identity to continue.
Note: This verification step won't sign you in. If you have a premium account, please log in to access the service as usual.
Google/Gmail Verification
Or verify using Email/Code
We've sent a verification code to:
youremail@gmail.com (Not your email?)
Enter it below to complete the verification process.
Ensure your email address is correct, your inbox is not full, and you check your spam folder. If no email arrives, consider using an alternative email.
You will need a Premium plan to perform your action!
Note: If you already have a premium account, please log in to access our services as usual.

Plans & Pricing

Our mission is to make quality education accessible for everyone.
However, to keep our hardworking team running and this service alive, we genuinely need your support!
By opting for a premium plan, not only do you sustain us in achieving the mission, but you also unlock advanced features to enrich your learning experience.

Free

For learners who aren't pressed for time

What's included on Free
100+ Cambridge IELTS Tests
Instant IELTS Writing Task 1 & 2 Evaluation (2 times/month)
Instant IELTS Speaking Part 1, 2, & 3 Evaluation (2 times/month)
Instant IELTS Writing Task 1 & 2 Essay Generator (2 times/month)
500+ Dictation & Shadowing Exercises
100+ Pronunciation Exercises
Flashcards
Other Advanced Tools

Premium

For those serious about advancing their English proficiency, and for IELTS candidates aspiring to boost their band score by 1-2 points (especially in writing & speaking) in just 30 days or less

What's included on Premium
Save Your IELTS Test Progress & Analyze Mistakes By Question Type
Save Your Own Flashcard Sets & Use Them On Any Device
Unlock All Courses, IELTS Tests, Section & Part Practice
Unlimited AI Conversations
Unlimited AI Writing Enhancement Exercises
Unlimited IELTS Writing Task 1 & 2 Evaluation
Unlimited IELTS Speaking Part 1, 2, & 3 Evaluation
Checked Answers Will Not Be Published
Unlimited IELTS Writing Task 1 & 2 Essay Generator
Unlimited IELTS Speaking Part 1, 2, & 3 Sample Generator
Unlimited Usage Of Advanced Tools & AI Features
Priority Support within 24h (12-month plan only)

Due to the nature of our service and the provided free trials, payments are non-refundable.