Our system will evaluate the answer based on this AI-generated description.
The image depicts a vertical bar graph titled "The Average Time Spent on Social Media from 2000 to 2020," with the x-axis representing years from 2016 to 2020 and the y-axis representing average time spent in minutes, ranging from 0 to 60 in increments of 10. Four social media platforms are shown: Facebook, Twitter, Instagram, and Snapchat. For 2016, Facebook usage is around 35, Twitter 30, Instagram 20, and Snapchat 10 minutes. In 2017, Facebook increases slightly above 35, Twitter dips below 30, Instagram jumps to just over 30, and Snapchat rises to around 15 minutes. The year 2018 shows Facebook at approximately 40, Twitter back to 30, Instagram close to around 45, and Snapchat at 20 minutes. The 2019 data shows a significant increase, with Facebook around 45, Twitter just above 30, Instagram at 50, and Snapchat nearing 30 minutes. Finally, in 2020, Facebook minutes are over 50, Twitter remains consistent at just above 30, Instagram reaches slightly below 60, and Snapchat rises above 30 minutes.
Given the complexity of the image, the above description may not be entirely accurate.
Skyrocket your IELTS band score by 1-2 points in under a month with our premium plan!
Note: Both the topic and the answer were created by one of our users.
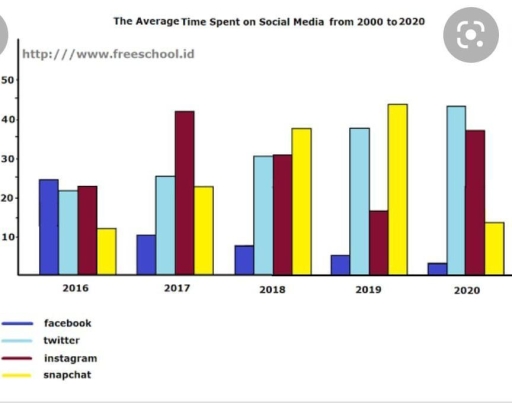
The bar chart shows the average time spent on social media between 2000 and 2020.
Overall, the bar charts were unstable all over the peiod.
In 2016 facebook, twitter and instagram were almost in the same place between 20 and 25, when the snapchat was lowest from these bar charts just below 10. In 2017 sitution is significantly different, because instagram increased to just below 40. On the one hand facebook became less popular and bar was on the level of 10. On the other hand snapchat became more popular slightly higher than 20. Twitter stayed almost in same position. In 2018 snapchat became the most popular social media with 35 spent time a day. While, facebook continued to decline in popularity with its level just under 10. Twitter and instagram stopped in the same position of 30. In 2019 twitter and snapchat became more popular, when facebook and instagram declined twice. In 2020 twitter reached the most level of own popularity with just below 35, while facebook reached the lowest level with 5. Instagram became more popular and snapchat lost its peak.
Word Count: 183
