Our system will evaluate the answer based on this AI-generated description.
The image displays a line graph titled "Average annual expenditure on cell phone, national and international fixed-line services, 2001-2010." Three lines represent different services: cell phone services (dashed line), international fixed-line services (solid line), and national fixed-line services (dotted line). The x-axis represents years from 2001 to 2010, and the y-axis shows expenditure in dollars, ranging from $100 to $800. The cell phone services line shows an upward trend starting at approximately $200 in 2001 and reaching $700 in 2010. The international fixed-line services line shows a downward trend starting at approximately $700 in 2001 and falling to $400 in 2010. The national fixed-line services line remains relatively stable, starting at around $300 in 2001, increasing slightly to $400 in the middle years, and ending around $300 in 2010.
Given the complexity of the image, the above description may not be entirely accurate.
Skyrocket your IELTS band score by 1-2 points in under a month with our premium plan!
Note: Both the topic and the answer were created by one of our users.
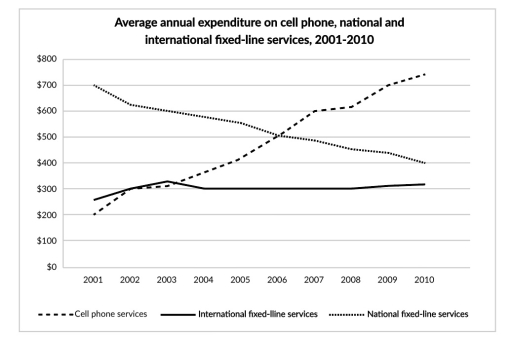
The line graph above shows the amount of money spent yearly on mobile phone services, national and international landline services from 2001 to 2010.
Overall, it is apparent that there was a preference shift between cellular phone and national-fixed line services, with the latter one being more favourable. Additionally, international fixed-line service’s figure remain stable over the period.
Started in 2001, cell phone was the top-choice service with nearly $700. However, it couldn’t remain its position as the total expenditure declined steadily until ending up at $400 in 2010. National fixed-line services, on the other hand, was the least fond of contacting type by users, with only $200 in the first year, more than half of cell phone’s figure. From there onwards, the total number spent dramatically surged, surpassed the figure of smart phone in 2007 and became the most common mean of communication in 2010 with over $700 annually spent.
Regarding the remaining competitor: international fixed-line services, began at the second place just under $300 initially. After a gradual increase in 2003, the reported money spent plateaued at above $300 throughout the time frame.
Word Count: 185