Our system will evaluate the answer based on this AI-generated description.
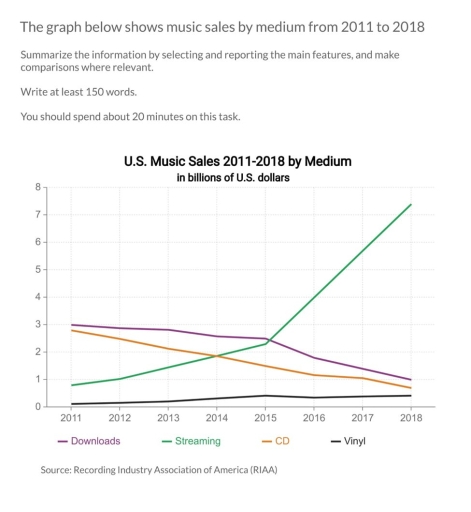
The image depicts U.S. music sales in billions of U.S. dollars from 2011-2018 for downloads, streaming, CD, and vinyl. In 2011, downloads were at 3.1, streaming at 0.6, CD at 3.6, and vinyl at 0.2. By 2012, downloads reached 3.5, streaming at 1.0, CD at 3.1, and vinyl remained at 0.2. In 2013, downloads decreased slightly to 3.4, streaming rose to 1.4, CD dropped to 2.7, and vinyl increased to 0.3. In 2014, downloads decreased to 3.0, streaming increased to 2.0, CD continued to drop to 2.2, and vinyl reached 0.4. In 2015, downloads fell to 2.3, streaming rose to 2.5, CD dropped to 2.0, and vinyl increased to 0.5. For 2016, downloads decreased to 1.8, streaming surpassed other mediums reaching 3.5, CD continued declining at 1.5, and vinyl climbed to 0.6. In 2017, downloads further decreased to 1.3, streaming at 4.3, CD at 1.1, and vinyl to 0.7. By 2018, downloads were at 0.9, streaming soared to 7.0, CD at 0.6, and vinyl at 0.8.
Given the complexity of the image, the above description may not be entirely accurate.
Skyrocket your IELTS band score by 1-2 points in under a month with our premium plan!
Note: Both the topic and the answer were created by one of our users.
The graph shows how people bought music in the U.S. from 2011 to 2018 using downloads, streaming, CDs, and vinyl.
In 2011, downloads were the most popular, with sales over $3 billion. However, download sales slowly went down each year, reaching below $2 billion by 2018. Streaming was very low in 2011 but grew quickly. By 2016, streaming sales became higher than downloads, and 2018, streaming was the top choice, making over $7 billion.
CD sales dropped steadily from around $2.5 billion in 2011 to less than $1 billion in 2018. Vinyl sales were always low, but they rose a bit by 2018, staying just under $1 billion.
Overall, the graph shows that people’s music choices changed a lot, with streaming becoming much more popular than downloads or CDs.
Word Count: 129
