🔥 Today Only: Save 30% on Premium — Offer Ends Soon! - Upgrade Now!
Line Graph

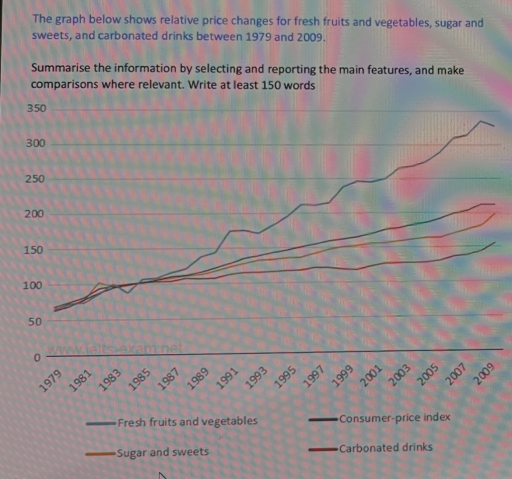
Band 5+: The graph below shows relative price changes for fresh fruits and vegetables, sugar and sweets, and carbonated drinks between 1979 and 2009. Summarise the information by selecting and reporting the main features, and make comparisons where relevant. Write at least 150 words

Image for topic: The graph below shows relative price changes for fresh fruits and vegetables, sugar and sweets, and carbonated drinks between 1979 and 2009. Summarise the information by selecting and reporting the main features, and make comparisons where relevant. Write at least 150 words
Our system will evaluate the answer based on this AI-generated description.
The image displays a line graph showing relative price changes from 1979 to 2009 for categories: fresh fruits and vegetables, consumer-price index, sugar and sweets, and carbonated drinks. In 1979, all categories start at 60. By 1983, fresh fruits and vegetables are at 60, consumer-price index at 75, sugar and sweets at 75, carbonated drinks at 75. By 1987, fresh fruits and vegetables rise to 120, consumer-price index to 90, sugar and sweets to 100, carbonated drinks to 90. By 1991, fresh fruits and vegetables reach 130, consumer-price index 105, sugar and sweets 110, carbonated drinks 110. By 1995, fresh fruits and vegetables increase to 180, consumer-price index 125, sugar and sweets 140, carbonated drinks 120. In 1999, fresh fruits and vegetables have a value of 220, consumer-price index 150, sugar and sweets 150, carbonated drinks 130. By 2003, fresh fruits and vegetables hit 240, consumer-price index 175, sugar and sweets 160, carbonated drinks 150. By 2007, fresh fruits and vegetables reach 280, consumer-price index 200, sugar and sweets 170, and carbonated drinks 160. Finally, in 2009, fresh fruits and vegetables climb to 330, consumer-price index 210, sugar and sweets 180, carbonated drinks 150.
Given the complexity of the image, the above description may not be entirely accurate.
Note: Both the topic and the answer were created by one of our users.

The chart gives information about changes of greens and sweets,fizzy drinks price from1979 to 2009.

Overall,the line graph shows upward trend.The price of fresh fruits and vegetables have been rising steadily between 1979-2009.Meanwhile carbonated drinks have the lowest increase.

The peak of price for greens and fresh fruits occurred in2007 with around 300-350.dollars.Unfortunately the price declined by 2009 accounts under 330dollars.The data was fluctuating between the two years.The price of fruits and vegetables in1989 to 1993 had been dipped (150-180)dollars.The following years between 1993-1997)has been grew stable.

In terms of the lowest one which was carbonated drinks hitted the highest price in 2009 made up 150 dollars.If comparing with fresh greens highest price which composed over350 the peak price of fizzy drinks was much more lower.Carbonate drinks trend had been remaining the same between 1985-1999.From 2003 to 2009 trend started grow upwards.

Word Count: 142

Answers On The Same Topic:

The graph below shows relative price changes for fresh fruits and vegetables, sugar and sweets, and carbonated drinks between 1979 and 2009. Summarise the information by selecting and reporting the main features, and make comparisons where relevant. Write at least 150 words

The line graph illustrates the difference in price for various type of nutrisions in 1979 and 2009. Overall,fresh fruits and vegetables became the overpriced and the carbonated drink became the less expensive choose between food.While fresh fruits and vegetables consistenly remained the most higly-priced,the carbonated drinks were overtaken by sugar and sweets. Fresh fruits and […]

The graph below shows relative price changes for fresh fruits and vegetables, sugar and sweets, and carbonated drinks between 1979 and 2009. Summarise the information by selecting and reporting the main features, and make comparisons where relevant. Write at least 150 words

The graph provides information about price changes for fresh fruits and vegetables, sugar and sweets, and carbonated drinks from 1979 to 2009. It is clear that the price for all consumable products had grown throughout the years, starting from 1 single value. Prices for fresh fruit and vegetables had significantly gone up, outpacing the others […]

See All

Other Topics:

The graph below shows the percentage of national arts funding allocated to five different sectors in the UK from 2000 to 2020. Summarise the information by selecting and reporting the main features, and make comparisons where relevant.

The given line graph indicates the number of national arts funding in different fields in the United Kingdom in between ten years. The five various sectors are Museums and Galleries, Theatre and Dance ,Music, Literature and Visual arts. Overall, museums and galleries, and visual arts experienced a upward trend with some factuation throughout the period. […]

The line graph below shows the percentage of Australian exports to 4 countries from 1990 to 2012.

The line graph provide information about the Australian export with countries like Japan, US, China and India the proportion of the Australian exports over 22-year period between 1990 and 2012. Looking from an overall perspective, it is readily apparent that four countries like Japan, US, China and India, which observed that during the given period […]

The graph below shows the percentage of national arts funding allocated to five different sectors in the UK from 2000 to 2020. Summarise the information by selecting and reporting the main features, and make comparisons where relevant.

The line graph gives information on the comparison of amounts of money allocated on 5 different kinds of art from 2000 to 2020. Overall, there was a downward trend in funding of almost every art section, despite visual arts. The highest percentage on the graph was “Museums and Galleries” and had remained the most popular […]

The graph below shows the number of international tourists (in millions) visiting three different countries between 1995 and 2015. Summarize the information by selecting and reporting the main features, and make comparisons where relevant.

The given line chart compares the number of international tourists, measured in millions, who visited France, Brazil, Egypt between 1995 and 2015. Overall, France recorded a steady upward trend and reamaned the most popular destination throughout the period. Brazil also saw a growth, while Egypt increased until 2005 before experiencing a slightly decline towards the […]

The graph below shows the number of international tourists (in millions) visiting three different countries between 1995 and 2015. Summarize the information by selecting and reporting the main features, and make comparisons where relevant.

The given line chart compares the number of international tourists, measured in millions, who visited France, Brazil, Egypt between 1995 and 2015. Overall, France recorded a steady upward trend and reamaned the most popular destination throughout the period. Brazil also saw moderate growth, while Egypt increased until 2005 before experiencing a slightly decline towards the […]

The graph below shows the number of international tourists (in millions) visiting three different countries between 1995 and 2015. Summarize the information by selecting and reporting the main features, and make comparisons where relevant.

The line graph illustrates the number of international tourists visiting three different countries between 1995 and 2015. Overall, during the period from 1995 to 2015, France was the highest and surged significantly. Besides, Brazil began with the lowest but had rose slightly, opposite with trend Egypt climbed consistently in 10 years and decreased steadily after […]

See All
We have detected unusual activity on your device.
Please verify your identity to continue.
Note: This verification step won't sign you in. If you have a premium account, please log in to access the service as usual.
Google/Gmail Verification
Or verify using Email/Code
We've sent a verification code to:
youremail@gmail.com (Not your email?)
Enter it below to complete the verification process.
Ensure your email address is correct, your inbox is not full, and you check your spam folder. If no email arrives, consider using an alternative email.
You will need a Premium plan to perform your action!
Note: If you already have a premium account, please log in to access our services as usual.

Plans & Pricing

Our mission is to make quality education accessible for everyone.
However, to keep our hardworking team running and this service alive, we genuinely need your support!
By opting for a premium plan, not only do you sustain us in achieving the mission, but you also unlock advanced features to enrich your learning experience.

Free

For learners who aren't pressed for time

What's included on Free
100+ Cambridge IELTS Tests
Instant IELTS Writing Task 1 & 2 Evaluation (2 times/month)
Instant IELTS Speaking Part 1, 2, & 3 Evaluation (2 times/month)
Instant IELTS Writing Task 1 & 2 Essay Generator (2 times/month)
500+ Dictation & Shadowing Exercises
100+ Pronunciation Exercises
Flashcards
Other Advanced Tools

Premium

For those serious about advancing their English proficiency, and for IELTS candidates aspiring to boost their band score by 1-2 points (especially in writing & speaking) in just 30 days or less

What's included on Premium
Save Your IELTS Test Progress & Analyze Mistakes By Question Type
Save Your Own Flashcard Sets & Use Them On Any Device
Unlock All Courses, IELTS Tests, Section & Part Practice
Unlimited AI Conversations
Unlimited AI Writing Enhancement Exercises
Unlimited IELTS Writing Task 1 & 2 Evaluation
Unlimited IELTS Speaking Part 1, 2, & 3 Evaluation
Checked Answers Will Not Be Published
Unlimited IELTS Writing Task 1 & 2 Essay Generator
Unlimited IELTS Speaking Part 1, 2, & 3 Sample Generator
Unlimited Usage Of Advanced Tools & AI Features
Priority Support within 24h (12-month plan only)

Due to the nature of our service and the provided free trials, payments are non-refundable.