Our system will evaluate the answer based on this AI-generated description.
The image displays a line graph showing relative price changes from 1979 to 2009 for categories: fresh fruits and vegetables, consumer-price index, sugar and sweets, and carbonated drinks. In 1979, all categories start at 60. By 1983, fresh fruits and vegetables are at 60, consumer-price index at 75, sugar and sweets at 75, carbonated drinks at 75. By 1987, fresh fruits and vegetables rise to 120, consumer-price index to 90, sugar and sweets to 100, carbonated drinks to 90. By 1991, fresh fruits and vegetables reach 130, consumer-price index 105, sugar and sweets 110, carbonated drinks 110. By 1995, fresh fruits and vegetables increase to 180, consumer-price index 125, sugar and sweets 140, carbonated drinks 120. In 1999, fresh fruits and vegetables have a value of 220, consumer-price index 150, sugar and sweets 150, carbonated drinks 130. By 2003, fresh fruits and vegetables hit 240, consumer-price index 175, sugar and sweets 160, carbonated drinks 150. By 2007, fresh fruits and vegetables reach 280, consumer-price index 200, sugar and sweets 170, and carbonated drinks 160. Finally, in 2009, fresh fruits and vegetables climb to 330, consumer-price index 210, sugar and sweets 180, carbonated drinks 150.
Given the complexity of the image, the above description may not be entirely accurate.
Skyrocket your IELTS band score by 1-2 points in under a month with our premium plan!
Note: Both the topic and the answer were created by one of our users.
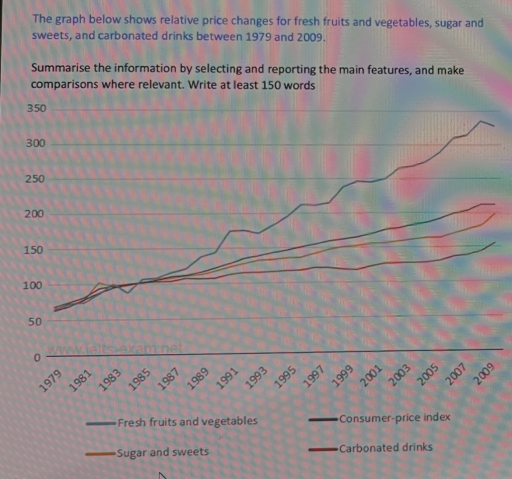
The graph provides information about price changes for fresh fruits and vegetables, sugar and sweets, and carbonated drinks from 1979 to 2009.
It is clear that the price for all consumable products had grown throughout the years, starting from 1 single value. Prices for fresh fruit and vegetables had significantly gone up, outpacing the others while the cost of the carbonated drinks remained steady.
The consumer price index had shown a noticeable increase throughout the years, setting off from around 60 and climbing up steadily to over 200 in 2009.
Fresh fruit and vegetables went above the CPI starting from 1989 and continued to increase dramatically reaching 330 in 2009 with multiple moderate fluctuations, still holding the leader position.
The remaining two were plainly below CPI level. Sugar and sweets improved noticeably over the whole period, but ceased under CPI line starting from 1989. Carbonated drinks showed a slight rise in 2009, reaching over 150, however in contrast with others consumable goods it remained rather stable throughout 1989 to 2005.
Word Count: 170