Our system will evaluate the answer based on this AI-generated description.
The image is a line graph titled Annual Cheese Consumption, it depicts the average cheese consumption in England, Scotland, Wales, and Northern Ireland between 1980 and 2020. Four lines represent each area, with data points at 1980, 1990, 2000, 2010, and 2020. England starts at 110 in 1980, increases to 125 in 1990, decreases to 100 in 2000, and remains at 100 in 2010 and 2020. Scotland begins at 50 in 1980, increases to 75 in 1990, drops to below 75 in 2000, rises to 75 in 2010, and decreases to just above 50 in 2020. Wales starts at 75 in 1980, decreases to 50 in 1990, increases to almost 100 in 2000, decreases to below 75 in 2010, and drops to 25 in 2020. Northern Ireland begins at 50 in 1980, increases to above 75 in 1990, decreases to 75 in 2000, remains at 75 in 2010, and slightly increases to above 75 in 2020. The vertical axis represents average cheese consumption in milligrams, ranging from 0 to 125, and the horizontal axis represents years from 1980 to 2020.
Given the complexity of the image, the above description may not be entirely accurate.
Skyrocket your IELTS band score by 1-2 points in under a month with our premium plan!
Note: Both the topic and the answer were created by one of our users.
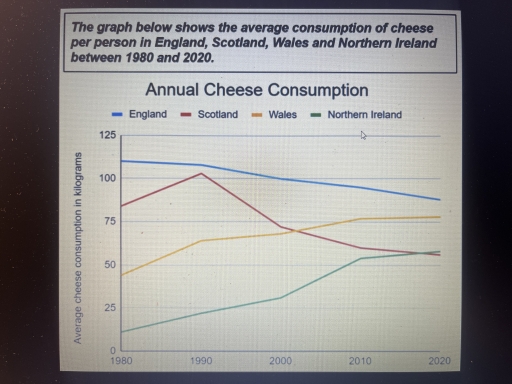
The graph compares the amount of cheese consumed for each individual in England, Scotland, Wales and Northern Ireland during 1980 and 2020.
It is evident that, all mentioned countries experienced different trends in the time period. While the consumption of cheese in Scotland and Wales rose with some fluctuations, the consumption in England fell over time.
As the graph shows, England’s cheese consumption started at approximately 110 kilograms in 1980, then it declined steadily until it fell to just around 80 kilograms by 2020. Regarding the consumption of cheese in Scotland, in 1980 it began at about 80 to 100 kilograms by 1990, then the figure saw a sharp decline from 2000 and fell to around 50 kilograms by 2020.
By contrast, the cheese consumption in Wales and Northern Ireland witnessed an increase in the 20 years period. In 1990, in Northern Ireland about 25 kilograms cheese was consumed while this number rose gradually to nearly 60 kilograms from 1995 to 2020. Subsequently, the country of Wales figure started off at about 50 kilograms cheese, then the consumption increased to nearly 60 kilograms in 1990 before witnessing steady growth to 70 kilograms and more than 75 kilograms from 1990 to 2020, respectively.
Word Count: 202