Our system will evaluate the answer based on this AI-generated description.
The image is a line graph titled Annual Cheese Consumption, it depicts the average cheese consumption in England, Scotland, Wales, and Northern Ireland between 1980 and 2020. Four lines represent each area, with data points at 1980, 1990, 2000, 2010, and 2020. England starts at 110 in 1980, increases to 125 in 1990, decreases to 100 in 2000, and remains at 100 in 2010 and 2020. Scotland begins at 50 in 1980, increases to 75 in 1990, drops to below 75 in 2000, rises to 75 in 2010, and decreases to just above 50 in 2020. Wales starts at 75 in 1980, decreases to 50 in 1990, increases to almost 100 in 2000, decreases to below 75 in 2010, and drops to 25 in 2020. Northern Ireland begins at 50 in 1980, increases to above 75 in 1990, decreases to 75 in 2000, remains at 75 in 2010, and slightly increases to above 75 in 2020. The vertical axis represents average cheese consumption in milligrams, ranging from 0 to 125, and the horizontal axis represents years from 1980 to 2020.
Given the complexity of the image, the above description may not be entirely accurate.
Skyrocket your IELTS band score by 1-2 points in under a month with our premium plan!
Note: Both the topic and the answer were created by one of our users.
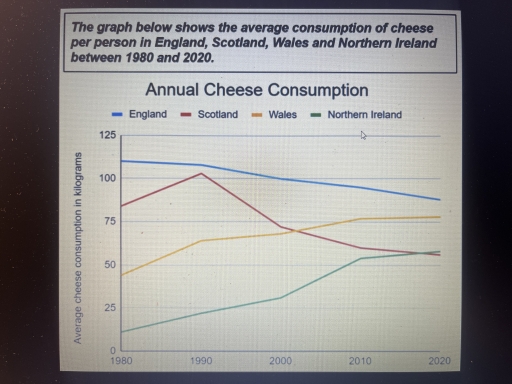
The given line graph illustrates the average consumption of cheese per person in four European countries from 1980 to 2012. Overall, it is clear that a rapid growth in the number of the cheese consumption was observed in Wales and Ireland. While, the number of it in England and Scotland decreased significantly.
Focusing on ascending figures, in 1980 consumption of cheese in Northern Ireland was around 20 kilograms and this figure increased to about 55. Additionally, Wales too experienced a dramatic growth from 45 to just over 75 during this period.
Turning to descending figures, the number of the cheese consumption in Scotland went up in the first decade, although in the next three decades it significantly dropped from 100 to 55. Similarly, In England there was decline, but it decreased constantly from 110 to 80 in this period; however, England at the beginning it was on top and remained there in the end.
Word Count: 154