Our system will evaluate the answer based on this AI-generated description.
The image illustrates average carbon dioxide emissions per person (1967-2007), starting with United Kingdom: 1967 (10.5 metric tonnes), 1972 (10.8 metric tonnes), 1977 (11 metric tonnes), 1982 (9.9 metric tonnes), 1987 (9.8 metric tonnes), 1992 (9.4 metric tonnes), 1997 (9.1 metric tonnes), 2002 (9 metric tonnes), 2007 (8.5 metric tonnes); Sweden: 1967 (8.9 metric tonnes), 1972 (10 metric tonnes), 1977 (10.4 metric tonnes), 1982 (8.3 metric tonnes), 1987 (7.6 metric tonnes), 1992 (6.5 metric tonnes), 1997 (6 metric tonnes), 2002 (5.4 metric tonnes), 2007 (5 metric tonnes); Italy: 1967 (4 metric tonnes), 1972 (5.5 metric tonnes), 1977 (6.5 metric tonnes), 1982 (7 metric tonnes), 1987 (7.8 metric tonnes), 1992 (8 metric tonnes), 1997 (8.1 metric tonnes), 2002 (8 metric tonnes), 2007 (7.8 metric tonnes); Portugal: 1967 (1.5 metric tonnes), 1972 (2 metric tonnes), 1977 (3 metric tonnes), 1982 (3.9 metric tonnes), 1987 (4.9 metric tonnes), 1992 (5.1 metric tonnes), 1997 (5.7 metric tonnes), 2002 (6.3 metric tonnes), 2007 (5.8 metric tonnes).
Given the complexity of the image, the above description may not be entirely accurate.
Skyrocket your IELTS band score by 1-2 points in under a month with our premium plan!
Note: Both the topic and the answer were created by one of our users.
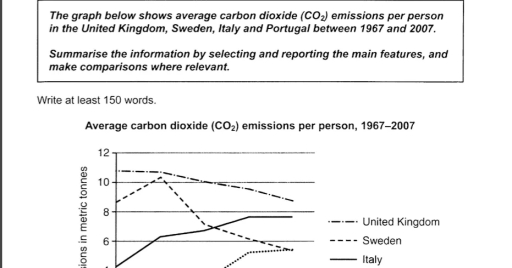
The supplied illustration of line graph demonstrates common carbon dioxide emmissions per person across 4 regions, such as the UK, Sweden, Italy, and Portugal from 1967 to 2007.
Overall, it is obvious that the Sweden individuals produced carbon emmissions fewer than other countries, while the rate of the italians increased.
With regards to Italy and Portugal, average number is rise in both nations. The figure of Italy comprised about 4 tonnes, following this stage the number grew dramatically to approximately 8. However, the quantity of CO2 in Portugal accounted for 2 tonnes, which was the lowest one compared to others, then this number increased signifficantly to almost 6 tonnes.
Turning to the UK and Sweden, both of them experienced a noticeble decline. Initially, ordinary number in the UK compared 11 tonnes, which was the number one ranked nation, then the figure declined steadilly to 9. Ultimately, Sweden witnessed some fluctuations, starting with 9 and ending with 6.
Word Count: 157