Our system will evaluate the answer based on this AI-generated description.
The image is a line graph titled Annual Cheese Consumption, it depicts the average cheese consumption in England, Scotland, Wales, and Northern Ireland between 1980 and 2020. Four lines represent each area, with data points at 1980, 1990, 2000, 2010, and 2020. England starts at 110 in 1980, increases to 125 in 1990, decreases to 100 in 2000, and remains at 100 in 2010 and 2020. Scotland begins at 50 in 1980, increases to 75 in 1990, drops to below 75 in 2000, rises to 75 in 2010, and decreases to just above 50 in 2020. Wales starts at 75 in 1980, decreases to 50 in 1990, increases to almost 100 in 2000, decreases to below 75 in 2010, and drops to 25 in 2020. Northern Ireland begins at 50 in 1980, increases to above 75 in 1990, decreases to 75 in 2000, remains at 75 in 2010, and slightly increases to above 75 in 2020. The vertical axis represents average cheese consumption in milligrams, ranging from 0 to 125, and the horizontal axis represents years from 1980 to 2020.
Given the complexity of the image, the above description may not be entirely accurate.
Skyrocket your IELTS band score by 1-2 points in under a month with our premium plan!
Note: Both the topic and the answer were created by one of our users.
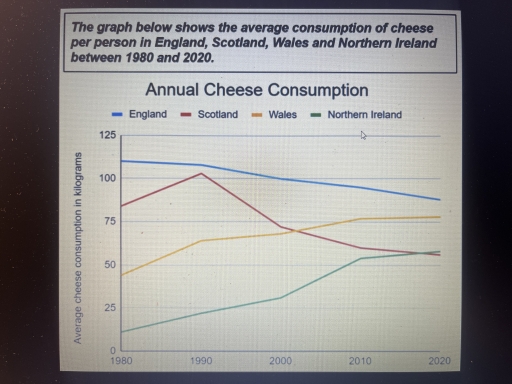
The line graph illustrates information regarding the each kilograms of cheese that citizen had eaten in 4 different countries of England, Scotland, Wales and Nothern Ireland between 1980 and 2020. Overall, it is evident from the graph that two countries leading in the beginning showed decreased consumption after 4years, while Wales and Nothern Ireland can see their people’s rising trend of cheese consuming.
As to details, amount of cheese which was on England’s dining table continuously dropped by 10kg from 110kg, even though still showing its significant cheese favored features for after 5 years. Scotland had fluctuated a shift from 1990 that uprising graphs above 100kg faced a dramatic decline to under 75kg and steadily dropped above by 20kg at the end.
Compared to the negative cheese consumption of Scotland, Wales and Nothern Ireland citizen’s cheese spending gradually climbed for 5 years . We can see 20kg increased in Wales from 50kg ,rapidly tracking second place in 2020. To add to that, Nothern Ireland people’s dull record of cheese under 25kg in 1990 reached over 50kg at the end, ranking third among 4 countries.
Word Count: 184