Our system will evaluate the answer based on this AI-generated description.
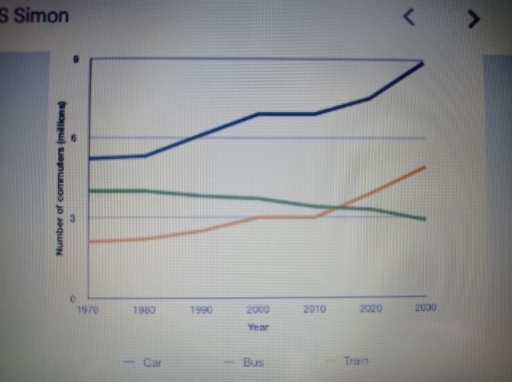
The image presents a line graph showing the number of commuters (in millions) by car, bus, and train from 1970 to 2030. In 1970, car commuters start at 5 million, bus commuters at 4 million, and train commuters at 2 million. By 1980, car commuters rise to 7 million, bus commuters slightly decrease to approximately 3.8 million, and train commuters increase to about 2.5 million. In 1990, car commuters reach 8 million, bus commuters decline to 3.5 million, and train commuters climb to 3 million. In 2000, car commuters remain steady at 8 million, bus commuters further decline to 3.2 million, and train commuters increase to 4 million. In 2010, car commuters remain stable just above 8 million, bus commuters fall to about 3 million, and train commuters rise to nearly 5 million. Projections for 2020 indicate car commuters at 9 million, bus commuters at 3 million, and train commuters at 5 million. For 2030, projections show car commuters at 9 million, bus commuters declining further to 2.5 million, and train commuters rising to 6 million.
Given the complexity of the image, the above description may not be entirely accurate.
Skyrocket your IELTS band score by 1-2 points in under a month with our premium plan!
Note: Both the topic and the answer were created by one of our users.
The line graph compares the proportion of people travelling every day by local transports like cars,bus or train over 60 years period between 1970 and 2030, at 10-year intervals.
Overall, throughout the period all figures experienced increased albeit at varying degrees, with the exception of the car, which saw a significant decrease. Although so many commuters had used buses at the beginning, the value of buses almost hit the bottom.
Starting with the increase first, the significant proportion of people who chose train to travel accounting of just under 3 million in 1970. However, between 2000 and 2010 the amount of travelers by trains remained fairly stable.Then from 2020 it rocketed. Despite the buses which had taken second place in the 1970 slowly started loosing its effort. After that it went down dramatically from 2000 and i the 2030 it bottomed out at about 3 million users.
On the other hand, between 1970 and 1980 there was a temporary stabilization in the proportion of car travelers. Next cars gained a widespread popularity among other transports from 1980 to 2000. Staring from at approximately 4 million, the figure for the cars increased marginally from 6 million to 7 million in 2020, and this was followed by a further increase to just under 9 million commuters by the end-the most noticeable change on the chart.
Word Count: 223
