Our system will evaluate the answer based on this AI-generated description.
The image shows a line graph of the average time to produce cars in the USA, measured in hours per vehicle, from 1998 to 2005 for four manufacturers: General Motors, Ford, Toyota, and Honda. In 1998, General Motors had approximately 32 hours, Ford had about 31 hours, Toyota had around 22 hours, and Honda was near 20 hours. By 1999, General Motors decreased to roughly 30 hours, Ford slightly decreased to 30 hours, Toyota stayed constant at 22 hours, and Honda decreased to 19 hours. In 2000, General Motors decreased further to around 28 hours, Ford increased to 31 hours, Toyota remained at 22 hours, and Honda dropped to 18 hours. In 2001, General Motors increased to 29 hours, Ford decreased to 29 hours, Toyota remained at 22 hours, and Honda was steady at 18 hours. In 2002, General Motors decreased to 27 hours, Ford decreased further to 27 hours, Toyota was consistent at 22 hours, and Honda maintained 18 hours. In 2003, General Motors reduced to 26 hours, Ford matched General Motors at 26 hours, Toyota dropped to 21 hours, and Honda was at 17 hours. By 2004, General Motors decreased to 25 hours, Ford declined to 26 hours, Toyota remained at 21 hours, and Honda stayed constant at 17 hours. In 2005, General Motors and Ford both dropped to approximately 24 hours, Toyota decreased to 20 hours, and Honda remained steady at 17 hours.
Given the complexity of the image, the above description may not be entirely accurate.
Skyrocket your IELTS band score by 1-2 points in under a month with our premium plan!
Note: Both the topic and the answer were created by one of our users.
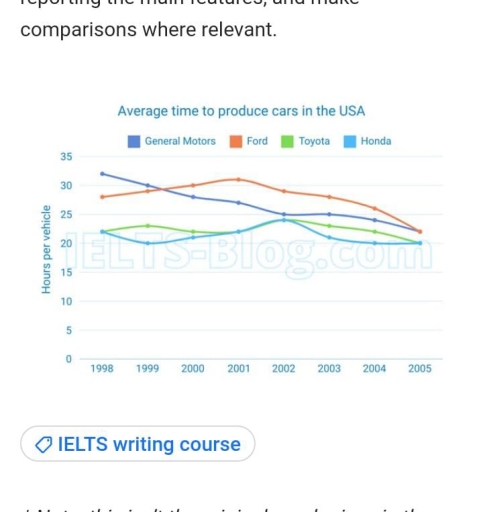
The line graph gives information about the time taken in US factories for car manufacturers to produce vehicles between the years 1998 and 2005.
Overall, the average time to produce cars in the USA for Ford showed a steady increase at the beginning of the period, but then it declined. However, the other manufacturers declined gradually over time. Toyota also showed small changes during the period. By the end of the timeline, all companies were almost at the same point.
In 1998, the average time to produce vehicles for Toyota and Honda started at about 22 hours. It decreased and increased slightly over the years. Meanwhile, Ford grew gradually until it reached its highest point in 2001. General Motors started at around 32 hours and then declined steadily until 2005.
After 2002, General Motors continued to fall slowly. Ford, Toyota, and Honda also began to decline slightly. By 2005, the production time for all companies became similar, at around 20-22 hours per vehicle.
Word Count: 163
